Multiple line graph
| Command: | Graphs |
Description
Creates a graph that shows consecutive observations of different variables.
Required input
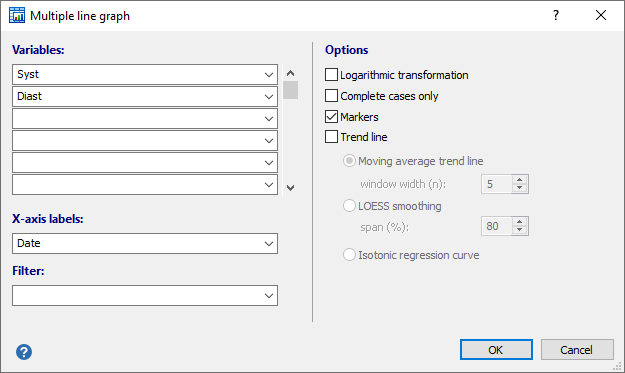
Select the variables of interest, and optionally a filter to include only particular cases in the graph.
Also you can enter a variable containing labels for the X-axis (e.g. dates).
Options
- Logarithmic transformation: if the data require a logarithmic transformation (e.g. when the data are positively skewed), select the Logarithmic transformation option.
- Complete cases only: a case (spreadsheet row) will only be included in the graph when data are available for all variables.
- Markers: mark observations in the graph.
- Trend line: option to plot one of the following trend lines:
- Moving average trend line: option to plot a moving average trend line for each variable.
A moving average trendline smooths out fluctuations in data to show a pattern or trend more clearly. A moving average trendline uses a specific number of data points (set by the window width option), averages them, and uses the average value as a point in the trendline. If window width is set to 3, for example, then the average of the first 3 data points is used as the first point in the moving average trendline. The average of the 2nd, 3rd and 4th data points is used as the second point in the trendline, and so on. - LOESS smoothing: option to plot a LOESS (Local Regression Smoothing) trendline. The degree of smoothing is controlled by the span (%) which is the proportion (expressed as a percentage) of the total number of points that contribute to each local fitted value. Larger values result in smoother trendlines.
- Isotonic regression curve:
- in case the tendency of the data is increasing: a fitted free-form line that is non-decreasing everywhere, and lies as close to the observations as possible
- in case the tendency of the data is decreasing: a fitted free-form line that is non-increasing everywhere, and lies as close to the observations as possible
- Moving average trend line: option to plot a moving average trend line for each variable.
Example

