Format graph
| Command: | Format |
| Button: | |
Description
Click the ![]() button in the Formatting toolbar to define the general format of the graph. The effects of the changes in the left panels (displayed below) of the dialog box can be previewed in the right side panel:
button in the Formatting toolbar to define the general format of the graph. The effects of the changes in the left panels (displayed below) of the dialog box can be previewed in the right side panel:

Graph color scheme box

- Select a predefined or user-defined color scheme.
- "Save scheme..." can be used to save the currently defined color selections as a named scheme for later use.
- When you click "Set as default", the current color scheme will be saved and used as the default color scheme for new graphs. The color schemes also include the Fills, Lines and Marker style and color selections.
- Click this button to delete the currently selected color scheme.
- Click this button to restore the different predefined color schemes.
Graph options box
- Display grid: displays gridlines in the graph.
- Plot area border: XY only: when this option is selected, lines for the X and Y axes are drawn. If this option is not selected, the plot area is enclosed in a rectangle.
- Outside tickmarks: select this option to have the tickmarks drawn on the outside of the graph frame.


Inside tickmarks Outside tickmarks - Side margins: this option lets you set a margin between the chart's plot area and lines for X and Y axis. This option is only available when the option Outside tickmarks is selected.
No side margins - Use digit grouping symbol in numbers: option to use the digit grouping symbol (thousands separator) in formatting numbers in the graph. E.g. when the digit grouping symbol is a comma, the number 10000 will be displayed as 10,000. The digit grouping symbol is taken from Windows' regional settings, or is a user-defined character specified in MedCalc options.
- Allow exponential notation: when this option is selected, the program will display small or large numbers in exponential notation, e.g. 2000000 will be displayed as 2x10⁶.
- Jitter overlapping data points: option to slightly shift ("jitter") coincident data points in scatter diagrams so that the markers do not completely overlap. See Applying jitter in scatter diagrams.
Graph titles
In this box you can edit the main text sections (titles and two axes) of the graph.

Toolbar
The toolbar contains buttons to apply Bold, Italic, Underline, Subscript and Superscript text styles.
Click the symbol button ![]() to insert a symbol (e.g. characters from the Greek alphabet) in the text.
to insert a symbol (e.g. characters from the Greek alphabet) in the text.

Click the desired symbol.
Graph axes
In this dialog box you can define the scaling of the X and/or Y-axis by entering the following information.
- Minimum: this is the lowest value that appears on the utmost left of the X-axis or bottom of the Y-axis;
- Maximum: this is the highest value that appears on the utmost right of the X-axis or top of the Y-axis;
- Increment: the increment value between two major grid lines;
- Minor tickmarks: the number of minor tickmarks between two major increments.

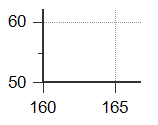
In MedCalc, the default increments are 1, 2 or 5 times a power of ten, yielding about 6 to 10 major tickmarks. If you are preparing a graph for publication, you are advised (Tukey, 1977) to limit the number of major tickmarks to about 2 or 3, so you will have to increase the value for increment, preferably also steps of 1, 2 or 5 times a power of 10.
If a logarithmic transformation of the data was selected in the graph's dialog box, then the information for the lowest value (Minimum) and Increment must be logarithmic values as well (e.g. for Minimum enter -2 for the value 0.01, or 0 for the value 1, 3 for the value 1000, etc.). Increment is then the exponent increment and should preferentially remain equal to 1.
Scale reversal: if you want to reverse the scale of the axis, you enter the higher value in the Minimum field and the lower value in the Maximum field. Scale reversal is possible for both X- and Y-axis in most MedCalc graphs.
When you click OK the graph will be replotted using the new axis scaling. However, the program will ignore a new axis scaling if this new scaling would cause data to fall outside the full axis range.
Font
In this box you can select the font, font style and font size used in the graph. The font Sample box (in which you can enter text freely) ignores the selected font size. The effect of font size can be seen in the Preview box.

Format graph components
To format different graph components, right-click on the component and click Format... on the context menu.
Example
In a box-and-whisker plot, right-click on a marker.

Click Format marker...
Select the desired marker attributes in the dialog box.

