Graphs
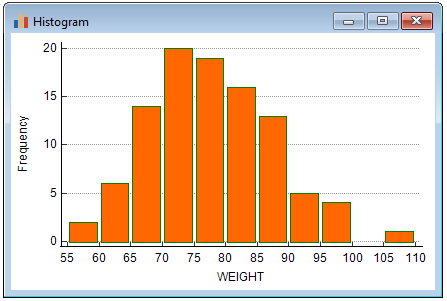
When you want to create a graph, proceed in a way similar as for any other statistical procedure. As an example, you will create a histogram for the variable Weight of the data file you have loaded in the previous section.
To obtain the histogram, you click Histogram on the Distribution plot submenu in the Statistics menu.

A dialog box is displayed similar to the one for Summary statistics. Again, enter the name of a variable and optionally a filter. If you have previously entered this filter in e.g. the box for summary statistics, then this it be selectable in the Select list (click the ![]() button).
button).

When you have identified the variable in the dialog box, click to proceed. The program will display the following box:

After you click , the histogram is displayed in a new window:

To get statistical information on the data represented in the graph (sample size, etc):
- press the right mouse button in the graph window:

- click Info on the context menu.
By clicking the ![]() button you can save the graph so you can easily recreate the graph later, possibly with new data. After you have clicked on the button the graph is added to the Saved tests and graphs list in the Contents window, with a default name which you can edit in the Contents window.
button you can save the graph so you can easily recreate the graph later, possibly with new data. After you have clicked on the button the graph is added to the Saved tests and graphs list in the Contents window, with a default name which you can edit in the Contents window.
Click the ![]() button in the Formatting toolbar to format the graph.
button in the Formatting toolbar to format the graph.
Export graph and use in PowerPoint
You can save the graph in SVG, TIF, PowerPoint or several other formats. See Export graphs for details.
