Frequencies bar charts
| Command: | Statistics |
Description
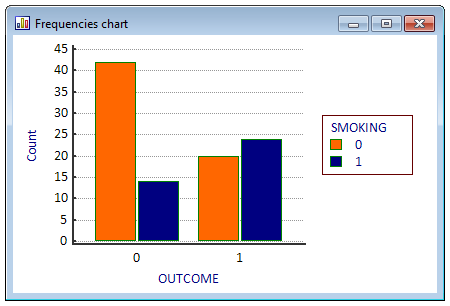
Use the Frequencies bar chart command to graph categorical data.
Required input
In the dialog box, one or two discrete variables with the classification data must be identified. Classification data may either be numeric or alphanumeric (string) values.

- Classification X: the first variable (main category)
- Classification Y: an optional second variable (secondary category)
- Option There is a variable containing counts
- When this option is not selected then MedCalc will count the occurrences of each category (or combination of categories if a second variable is selected).
- When this option is selected then an additional selector is presented in the dialog box to select a variable that contains counts.

- Filter: a filter to include selected cases.
Graph types:


Options
- Relative frequency (%): represent the data as percentages, not counts. This option is applicable to the Simple and Clustered column charts only. The Stacked column graph always shows counts, the 100% Stacked column graph always shows percentages.
- Sort by magnitude: sort by the magnitude of the main category.
- Reverse order X: option to reverse the order of the categories of the first variable.
- Reverse order Y: option to reverse the order of the categories of the second variable.
Graph orientation
Select a vertical or horizontal layout.
Graph