Chi-squared test
| Command: | Statistics |
Description
The Chi-squared test can be used for the following:
One variable - one-way classification
To test the hypothesis that for one classification table (e.g. gender), all classification levels have the same frequency. Only one discrete variable must be identified in the dialog box, and the null hypothesis is that all classification levels have the same frequency. If the calculated P-value is small (<0.05), then the null hypothesis is rejected and the alternative hypothesis that there is a significant difference between the frequencies of the different classification levels must be accepted.
Two variables - two-way classification
To test the relationship between two classification factors (e.g. gender and profession). In this case two discrete variables must be identified in the dialog box, and the null hypothesis is that the two factors are independent. If the calculated P-value is small (<0.05), then the null hypothesis is rejected and the alternative hypothesis that there is a relation between the two factors must be accepted.
How to enter data
In the following example we have two categorical variables. For the variable OUTCOME a code 1 is entered for a positive outcome and a code 0 for a negative outcome. For the variable SMOKING a code 1 is used for the subjects that smoke, and a code 0 for the subjects that do not smoke. The data of each case is entered on one row of the spreadsheet.

Required input
In the Chi-squared test dialog box, one or two discrete variables with the classification data must be identified. Classification data may either be numeric or alphanumeric (string) values. If required, you can convert a continuous variable into a discrete variable using the IF function (see elsewhere).

Option Show all percentages (only available for two-way classification): see example below.
Results
After you have completed the dialog box, click OK to obtain the frequency table with the relevant statistics.
Classification table

When you select the option Show all percentages in the dialog box, all percentages are shown in the table as follows:
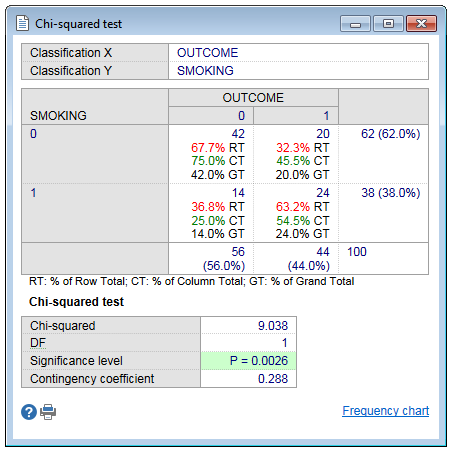
In this example the number 42 in the upper left cell (for both Codes X and Coded Y equal to 0) is 67.7% of the row total of 62 cases; 75% of the column total of 56 cases and 42% of the grand total of 100 cases.
Chi-squared test
The Chi-squared statistic is the sum of the squares of the differences of observed and expected frequency divided by the expected frequency for every cell:
Single classification factor
When you want to test the hypothesis that for one single classification table (e.g. gender), all classification levels have the same frequency, then identify only one discrete variable in the dialog form. In this case the null hypothesis is that all classification levels have the same frequency. If the calculated P-value is low (P<0.05), then you reject the null hypothesis and the alternative hypothesis that there is a significant difference between the frequencies of the different classification levels must be accepted.
In a single classification table the mode of the observations is the most common observation or category (the observation with the highest frequency). A unimodal distribution has one mode; a bimodal distribution, two modes.
Two classification factors
When you want to study the relationship between two classification factors (e.g. gender and profession), then identify the two discrete variables in the dialog form. In this case the null hypothesis is that the two factors are independent. If the calculated P-value is low (P<0.05), then the null hypothesis is rejected and you accept the alternative hypothesis that there is a relation between the two factors.
Chi-squared test for trend
If the table has two columns and three or more rows (or two rows and three or more columns), and the categories can be quantified, MedCalc will also perform the Chi-squared test for trend. The Cochran-Armitage test for trend (Cochran, 1954; Armitage, 1955) tests whether there is a linear trend between row (or column) number and the fraction of subjects in the left column (or top row). The Cochran-Armitage test for trend provides a more powerful test than the unordered independence test above.
If there is no meaningful order in the row (or column) categories, then you should ignore this calculation.
Analysis of 2x2 table
- For a 2x2 table, MedCalc uses the "N−1" Chi-squared test as recommended by Campbell (2007) and Richardson (2011). In the "N−1" Chi-squared test, χ2 as given above is multiplied by a factor (N-1)/N. The use of Yates' continuity correction is no longer recommended.
- When the two classification factors are not independent, or when you want to test the difference between proportions in related or paired observations (e.g. in studies in which patients serve as their own control), you must use the McNemar test.
Small expected frequencies
It is a common misconception that the Chi-squared test is not reliable when there are one or more cells with expected frequencies less than 5.
When searching the internet, you may find many sites stating so, but none of those cite a reference.
But according to Pagano & Gauvreau (2000):
"no cell in the table should have an expected count less than 1, and no more than 20% of the cells should have an expected count less than 5" (with reference to Cochran, 1954).
And indeed, according to Cochran (1954):
"The 2x2 table. Use Fisher's exact test (i) if the total N of the table <2 0, (ii) if 20 < N < 40 and the smallest expectation is less than 5.
Contingency tables with more than 1 d.f. If relative few expectations are less than 5 (say in 1 cell out of 5 or more, or 2 cells out of 10 or more), a minimum expectation of 1 is allowable in computing χ2.";
and
"If χ2 has less than 30 degrees of freedom and the minimum expectation is 2 or more, use of the ordinary χ2 tables is usually adequate."
A study by Koehler and Lartnz (1980) (cited by Connover 1999, p. 241) finds the Chi-squared approximation to be adequate as long as N ≥ 10, c ≥ 3, N2/c ≥ 10, and all Ej ≥ 0.25 (with c the number of cells, and Ej the expected number in cell j).
Literature
- Altman DG (1991) Practical statistics for medical research. London: Chapman and Hall.
- Armitage P (1955) Tests for linear trends in proportions and frequencies. Biometrics 11:375-386.
- Campbell I (2007) Chi-squared and Fisher-Irwin tests of two-by-two tables with small sample recommendations. Statistics in Medicine 26:3661-3675.

- Cochran WG (1954) Some methods for strengthening the common χ2 tests. Biometrics 10:417-451.
- Conover WJ (1999) Practical non-parametric statistics, 3rd edition. New York: John Wiley & Sons.
- Koehler KJ, Lartnz K (1980) An empirical investigation of goodness-of-fit statistics for sparse multinomials. Journal of the American Statistical Association 75:336-344.
- Pagano M, Gauvreau K (2000) Principles of biostatistics, 2nd ed. Brooks/Cole, Cengage Learning.
- Richardson JTE (2011) The analysis of 2 x 2 contingency tables - Yet again. Statistics in Medicine 30:890.
