How to define and use labels for the different categories of a variable
In MedCalc the preferred way to enter data on categorical data, in particular for ordered categorical data, is to use numerical codes.
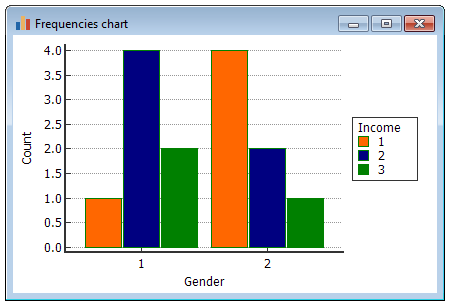
Data on gender and income could for example be entered as follows:

In this example, gender is coded as male=1 and female=2, and income level is coded as 1=low, 2=average, and 3=high).
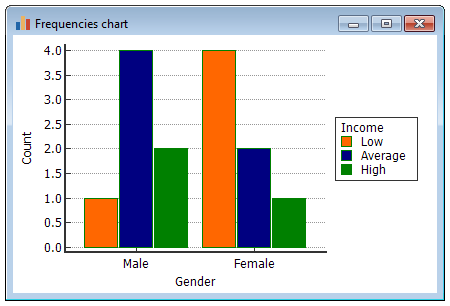
If you create a frequency bar chart, the chart will look like this:
But how can we display the labels "male", "female", and "low", "average" and "high" in the graph instead of the numbers?
Proceed as follows.
To define a variable's properties, first click Edit variables list on the Tools menu, or click Variables in the Contents bar at the left side of the MedCalc window.

In this dialog box you select the variable of interest and click .
In the new dialog box you can define the variable properties (formula, variable label and value labels).

In this dialog box:
- Click to scan the data and to populate the list with existing values in the spreadsheet for this variable.
- Next to each value, enter the label corresponding to this value.
- Click the
 and
and  arrow buttons to move selected rows up or down; this will influence the order in which the categories will appear in the graph.

Proceed similarly for the variable Income:

Now when you recreate the frequency chart the chart will display the labels.