Fisher's exact test
| Command: | Statistics |
Description
If you have a 2x2 frequency table with small numbers of expected frequencies (in case the total number of observations is less than 20), you should not perform the Chi-squared test, but you should use Fisher's exact test.
Required input
In the Fisher's exact test dialog box, two discrete dichotomous variables with the classification data must be identified. Classification data may either be numeric or alphanumeric (string) values. If required, you can convert a continuous variable into a dichotomous variable using the IF function (see elsewhere).
For example: in a study including 20 patients, 9 women and 11 men, the success of a treatment is recorded (1 = successful, 0 =no success). Is there a difference between the success rate in men and women?
The data are entered as follows in the spreadsheet:

The dialog box for the Fisher's exact test is completed as follows:

Option Show all percentages: see example below.
After you have completed the dialog box, click OK to obtain the frequency table with the relevant statistics.
Classification table
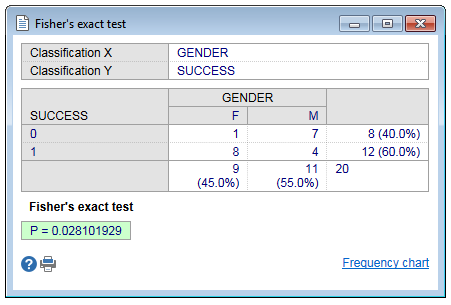
The program displays the 2x2 classification table.

When you select the option Show all percentages in the dialog box, all percentages are shown in the table as follows:

In this example the number 1 in the upper left cell (for Classification X equal to "F" and Classification Y equal to 0) is 12.5% of the row total of 8 cases; 11.1% of the column total of 9 cases and 5.0% of the grand total of 20 cases.
P-value
When the (two-sided) P-value (the probability of obtaining the observed result or a more extreme result) is less than the conventional 0.05, the conclusion is that there is a significant relationship between the two classification factors.
In the example P=0.028 and the conclusion therefore is that the success rate in men and women differs (or that the success rate is related to gender).
Literature
- Altman DG (1991) Practical statistics for medical research. London: Chapman and Hall.
