Create ROC curves easily
MedCalc allows to perform ROC curve analysis easily and accurately. Our ROC curve analysis module includes:
- Area under the curve (AUC) with standard error (SE) and 95% confidence interval (CI). The standard error can be calculated using 2 methods:
- DeLong et al. (1988)
- Hanley & McNeil (1982)
The Confidence Interval for the AUC can be calculated using the following methods:
- Binomial exact confidence interval
- AUC ± 1.96 its Standard Error.
- Calculate optimal criterion value taking into account costs: option to calculate the optimal criterion value taking into account the disease prevalence and cost of false and true positive and negative decisions (Zweig & Campbell, 1993).
- Calculation of Youden index.
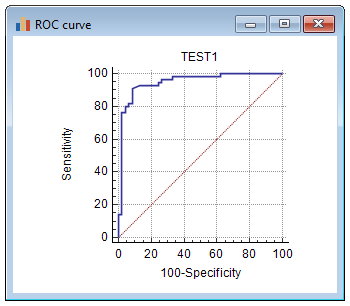
- ROC curve graph with 95% Confidence Bounds.
- Plot of sensitivity and specificity versus criterion values.
- Plot versus prevalence
- Interval likelihood ratios
- Partial area under ROC curve
- Comparison of partial areas under ROC curves
- Precision-recall curve
- Comparison of precision-recall curves
- Sample size calculation for area under ROC curve and comparison of ROC curves.
MedCalc creates a list of sensitivity, specificity, likelihood ratios, and positive and negative predictive values for all possible threshold values.
Threshold values can be selected in an Interactive dot diagram with automatic calculation of corresponding sensitivity and specificity.
Advanced options
MedCalc offers the following unique advanced options:
- Estimation of sensitivity and specificity at fixed specificity and sensitivity: an option to compile a table with estimation of sensitivity and specificity (with a BCa bootstrapped 95% confidence interval) for a fixed and prespecified specificity and sensitivity of 80%, 90%, 95% and 97.5% (Zhou et al., 2002).
- Bootstrap Youden index confidence interval: an option to calculate a BCa bootstrapped 95% confidence interval (Efron & Tibshirani, 1994) for the Youden index and its associated criterion value.
These options require bootstrapping which is a computationally intensive and sometimes time consuming technique.
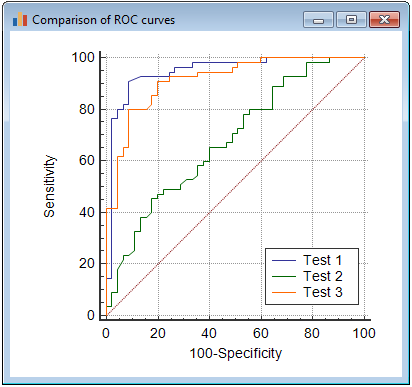
Comparison of ROC curves
- MedCalc can compare up to 6 ROC curves with the method of DeLong et al. (1988) or Hanley & McNeil (1983). The software gives the difference between the areas under the ROC curves, with standard error, 95% confidence interval and P-value.
Graphs
ROC curve
Interactive dot diagram

Comparison of ROC curves
Literature
- DeLong ER, DeLong DM, Clarke-Pearson DL (1988) Comparing the areas under two or more correlated receiver operating characteristic curves: a non-parametric approach. Biometrics 44:837-845.

- Efron B, Tibshirani RJ (1994) An introduction to the Bootstrap. Chapman & Hall/CRC.
- Griner PF, Mayewski RJ, Mushlin AI, Greenland P (1981) Selection and interpretation of diagnostic tests and procedures. Annals of Internal Medicine 94:555-600.
- Hanley JA, Hajian-Tilaki KO (1997) Sampling variability of non-parametric estimates of the areas under receiver operating characteristic curves: an update. Academic Radiology 4:49-58.
- Hanley JA, McNeil BJ (1982) The meaning and use of the area under a receiver operating characteristic (ROC) curve. Radiology 143:29-36.
- Hilgers RA (1991) Distribution-free confidence bounds for ROC curves. Methods of Information in Medicine 30:96-101.
- Metz CE (1978) Basic principles of ROC analysis. Seminars in Nuclear Medicine 8:283-298.
- Youden WJ (1950) An index for rating diagnostic tests. Cancer 3:32-35.
- Zhou XH, Obuchowski NA, McClish DK (2002) Statistical methods in diagnostic medicine. Wiley-Interscience.
- Zweig MH, Campbell G (1993) Receiver-operating characteristic (ROC) plots: a fundamental evaluation tool in clinical medicine. Clinical Chemistry 39:561-577.
Links
- Download free trial
- ROC curve analysis section of the MedCalc manual.
