Comparison of ROC curves
| Command: | Statistics |
Description
Use Comparison of ROC curves to test the statistical significance of the difference between the areas under 2 to 6 dependent ROC curves (derived from the same cases) with the method of DeLong et al. (1988) or Hanley & McNeil, 1983.
Required input
In the dialog box you need to enter:

Data
- Variables: select the variables of interest (at least 2, maximum 6).
- Classification variable: select a dichotomous variable indicating diagnosis (0=negative, 1=positive).If your data are coded differently, you can use the Define status tool to recode your data.
- Filter: (optionally) a filter in order to include only a selected subgroup of cases (e.g. AGE>21, SEX="Male").
Methodology:
- DeLong et al.: use the method of Delong et al. (1988) for the calculation of the Standard Error of the Area Under the Curve (AUC) and of the difference between two AUCs (recommended).
- Hanley & McNeil: use the methods of Hanley & McNeil (1982, 1983) for the calculation of the Standard Error of the Area Under the Curve (AUC) and of the difference between two AUCs.
- Binomial exact Confidence Interval for the AUC: calculate exact Binomial Confidence Intervals for the Area Under the Curves (AUC) (recommended). If this option is not selected, the Confidence Intervals for the AUCs are calculated as AUC ± 1.96 SE (Standard Error). This option does not apply to the difference between two AUCs).
Graph
- Select Display ROC curves window to obtain the ROC curves in a separate graph window.
Option:
- mark points corresponding to criterion values.
When you have completed the dialog box, click OK to proceed.
Results
The results window shows the data for the different ROC curves followed by the result of pairwise comparison of all ROC curves: the difference between the areas, the standard error, the 95% confidence interval for the difference and P-value. If P is less than the conventional 5% (P<0.05), the conclusion is that the two compared areas are significantly different.

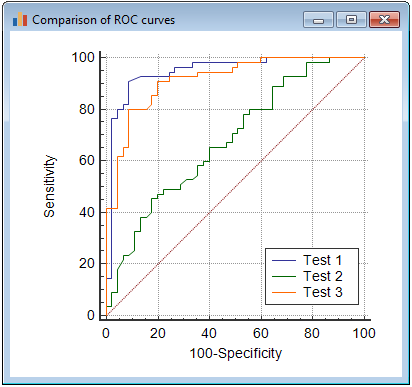
Display Roc curves
When you have selected Display ROC curves window in the dialog box, the program will also open a graph window with the different ROC curves.
Literature
- DeLong ER, DeLong DM, Clarke-Pearson DL (1988): Comparing the areas under two or more correlated receiver operating characteristic curves: a non-parametric approach. Biometrics 44:837-845.

- Hanley JA, Hajian-Tilaki KO (1997) Sampling variability of non-parametric estimates of the areas under receiver operating characteristic curves: an update. Academic Rediology 4:49-58.
- Hanley JA, McNeil BJ (1982) The meaning and use of the area under a receiver operating characteristic (ROC) curve. Radiology 143:29-36.
- Hanley JA, McNeil BJ (1983) A method of comparing the areas under receiver operating characteristic curves derived from the same cases. Radiology 148:839-843.
