Comparison of precision-recall curves
| Command: | Statistics |
Description
A precision-recall curve is a plot of the precision (positive predictive value, y-axis) against the recall (sensitivity, x-axis) for different thresholds. It is an alternative for the ROC curve (Saito & Rehmsmeier, 2015).
If MedCalc's comparison of precision-recall curves, the precision-recall curves of two dependent or independent variables are constructed. "Dependent variables" means that the data of the two variables are derived from the same cases (subjects, samples, patients, ...) and are therefore paired.
MedCalc generates the precision-recall curves from the raw data (not from a sensitivity-PPV table), and calculates the difference between the areas under the two curves, together with the 95% BCa bootstrap confidence interval for this difference.
How to enter data for a precision-recall curve
In order to create the precision-recall curves you should have the two measurements of interest (= the parameters you want to study) and an independent diagnosis which classifies your study subjects into two distinct groups: a diseased and non-diseased group. The latter diagnosis should be independent from the measurements of interest.
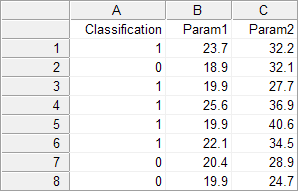
In the spreadsheet, create a column Classification and two columns for the variables of interest, e.g. Param1 and Param2. For every study subject enter a code for the classification as follows: 1 for the diseased cases, and 0 for the non-diseased or normal cases. In the Param1 and Param2 columns, enter the measurements of interest for each case on the same row (this can be measurements, grades, etc. - if the data are categorical, code them with numerical values).
Required input
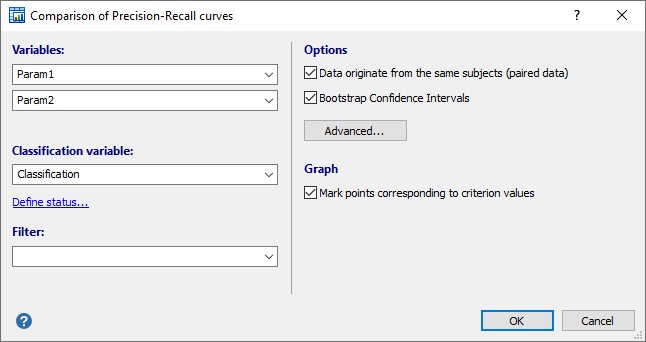
- Variables: select the two variables of interest.
- Classification variable: select a dichotomous variable indicating diagnosis (0=negative, 1=positive).
If your data are coded differently, you can use the Define status tool to recode your data.
It is important to correctly identify the positive cases.
- Filter: (optionally) a filter in order to include only a selected subgroup of cases (e.g. AGE>21, SEX="Male").
- Options:
- Data originate from the same subjects (paired data): select this option of the two variables contain data that originate from the same subjects. If the two datasets come from different subjects, then there is no paired design and you unselect this option. It is important to make this distinction because the statistical power of the test is different for a paired or independent samples model.
- Bootstrap Confidence Interval: select this option to calculate a confidence interval the difference between Area Under the Precision-Recall curves (AUPRC) using the bootstrap technique.
- Advanced: click this button to specify the bootstrap parameters: number of replications and random number seed.
- Graph:
- Option to mark points corresponding to criterion values.
Results - Paired samples
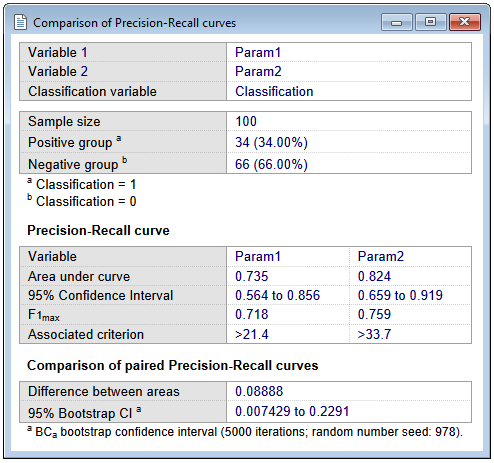
First MedCalc reports the following statistics for each variable:
- The sample sizes in the positive and negative groups.
- The area under the precision-recall curve (AUPRC), calculated using non-linear interpolation (Davis & Goadrich, 2006).
- F1max: the F1 score is a measure of a test's accuracy, and is the harmonic mean of the precision and recall. It is calculated at each measurement level and F1max is the maximum F1 score over all measurement levels.
$$ F_1 = 2 \times \frac{Recall \times Precision}{Recall + Precision } $$
- Associated criterion: the criterion (measurement level) at which F1max was reached.
- The 95% Confidence Interval for AUPRC, which is calculated as follows (Boyd et al, 2013; Logit method):
$$ CI(AUPRC) = \left[ \frac{e^{\mu_\eta - 1.96 \tau}}{1+ e^{\mu_\eta - 1.96 \tau}} \; ; \; \frac{e^{\mu_\eta + 1.96 \tau}}{1+ e^{\mu_\eta + 1.96 \tau}} \right] $$
where
$$ \mu_\eta = logit(AUPRC) = \ln \left ( \frac {AUPRC} {1-AUPRC} \right ) $$ $$\tau = \frac{1}{\sqrt{n*AUPRC*(1-AUPRC)}} $$
See also a note on Criterion values.
Results - Independent samples
The report for independent samples is somewhat different, but essentially contains the same statistics:
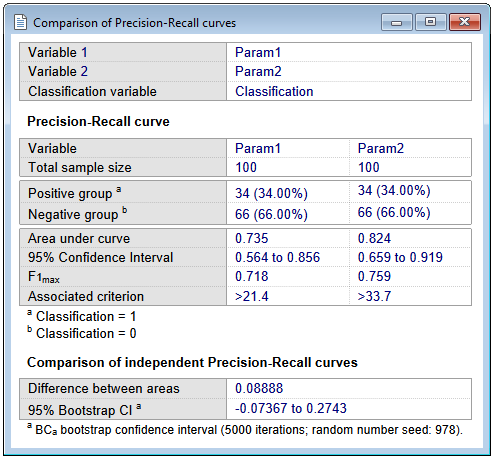
Comparison of the two precision-recall curves
MedCalc reports:
- The difference between the two areas under the precision-recall curve (AUPRCs).
- The 95% BCa bootstrap confidence interval for this difference, if the corresponding option was selected. If the confidence interval does not include 0, then it can be concluded that the two areas are significantly different (P<0.05).
Graph
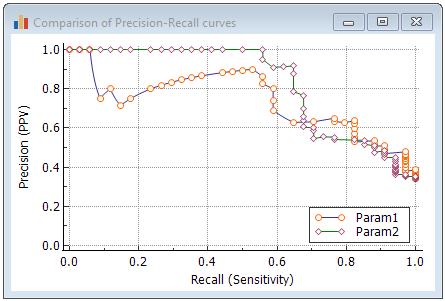
When the option to mark points corresponding to criterion values in the graph was selected, then when you click on a marker, the corresponding criterion (for positivity) will be given together with recall (sensitivity), precision (positive predictive value) and F1 score.
Literature
- Boyd K, Eng KH, Page CD (2013) Area under the Precision-Recall Curve: Point Estimates and Confidence Intervals. In: Blockeel H, Kersting K, Nijssen S, Železný F (eds) Machine Learning and Knowledge Discovery in Databases. ECML PKDD 2013. Lecture Notes in Computer Science, vol 8190. Springer, Berlin, Heidelberg.
- Davis J, Goadrich M (2006) The relationship between precision-recall and ROC curves. Proceedings of the 23rd International Conference on Machine Learning, Pittsburgh, PA, 2006.
- Efron B (1987) Better Bootstrap Confidence Intervals. Journal of the American Statistical Association 82:171-185.
- Efron B, Tibshirani RJ (1993) An introduction to the Bootstrap. Chapman & Hall/CRC.
- Saito T, Rehmsmeier M (2015) The precision-recall plot is more informative than the ROC plot when evaluating binary classifiers on imbalanced datasets. Plos One 10:e0118432.