Create summary statistics table
| Command: | Statistics |
Description
Allows to create a publication-ready summary statistics of several variables and possible subgroups.
Required input

- Variables: select the variables of interest in the top left box and next click the right arrow button to move the selection to the Selected variables list.
- Grouping variable: (optionally) a categorical variable that defines subgroups.
- Filter: an optional filter.
- Options
- Statistics: click this button to select the statistics to be displayed in the table: Sample size, mean, 95% CI for the mean, etc.

- Try Logarithmic transformation if distribution is not Normal: if this option is selected the software will perform a test for Normal distribution for all variables. If the data of a variable are found not to be Normally distributed, a Logarithmic transformation is attempted. If after logarithmic transformation the data are found to agree better with a Normal distribution, the transformation is applied and the back-transformed results will be displayed in the table.
- Report variables vertically or horizontally: option to report the variables vertically (in rows below each other) or horizontally (in columns next to each other).
- Statistics: click this button to select the statistics to be displayed in the table: Sample size, mean, 95% CI for the mean, etc.
Results
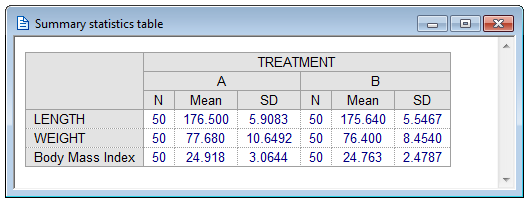
The results window displays the summary statistics table.
With the option 'Report variables vertically':
With the option 'Report variables horizontally':

The reported statistics are described on Summary statistics.
