Odds ratio
| Command: | Tests |
Description
Allows to calculate an Odds ratio, which is the ratio of the odds of the outcome in two groups (retrospective study). In a retrospective study the cases with positive and negative outcome are known and are subsequently grouped according to a specific characteristic.
This test is not performed on data in the spreadsheet, but on statistics you enter in a dialog box.
Required input

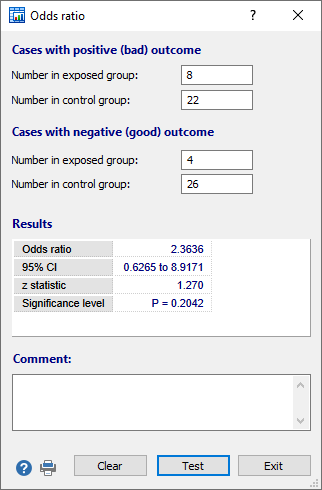
In the dialog box you enter the number of cases in the exposed group and the control group that have a positive (bad) or negative (good) outcome. Next click Test to perform the test.
Results
The program displays the odds ratio, which is the ratio of the odds of the outcome in the two groups. The program also calculates a 95% confidence interval for the odds ratio, the z-statistic and associated P-value. If P is less than 0.05 then it can be concluded that the odds in one group are significantly higher than in the other.
In the example 30 cases with a positive and 30 cases with a negative outcome were selected. Next the occurrence of a particular characteristic was retrospectively investigated. For the cases with a positive outcome, 8 cases presented the characteristic (were exposed to a particular risk) and 22 did not. For the cases with a negative outcome, 4 cases presented the characteristic and 26 did not.
The resulting odds ratio is 2.4 with a 95% confidence interval ranging from 0.6 to 8.9. The z-statistic is 1.270 and the associated P-value equals 0.2042. The conclusion is that although there is a 2.4-fold increased odds of a positive outcome, this increase is not statistically significant at the 5% level.
In an optional Comment input field you can enter a comment or conclusion that will be included on the printed report.
Literature
- Altman DG (1991) Practical statistics for medical research. London: Chapman and Hall.
- Sheskin DJ (2011) Handbook of parametric and non-parametric statistical procedures. 5th ed. Boca Raton: Chapman & Hall /CRC.
