Paired samples t-test
| Command: | Statistics |
Description
The paired t-test is used to test the null hypothesis that the average of the differences between a series of paired observations is zero. Observations are paired when, for example, they are performed on the same samples or subjects.
Required input

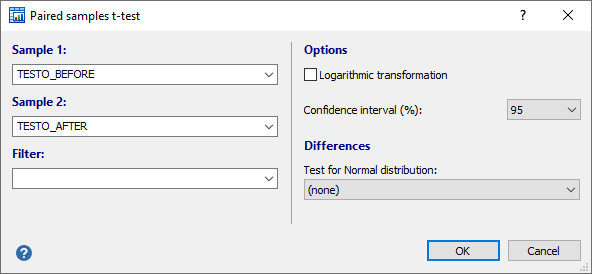
Select the variables for sample 1 and sample 2, and a possible filter for the data pairs. You can use the ![]() button to select variables and filters in the variables list.
button to select variables and filters in the variables list.
Options
- Logarithmic transformation: if the data require a logarithmic transformation (e.g. when the data are positively skewed), select the Logarithmic transformation option.
- Confidence interval: select the required confidence interval for the difference between the means. A 95% confidence interval is the usual selection, select a 90% confidence interval for equivalence testing.
- You can select an optional Test for Normal distribution of the differences between the paired observations.
Results
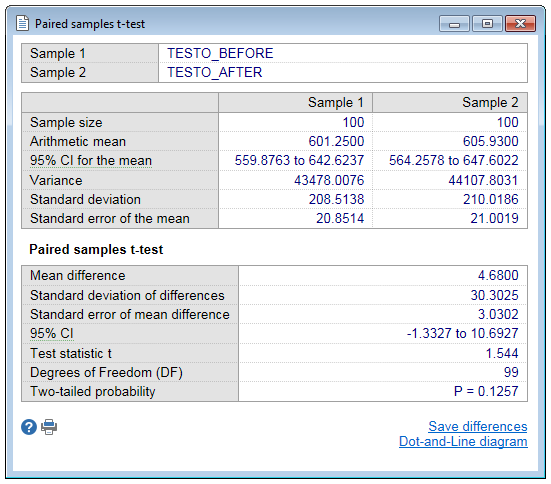
The results windows for the paired samples t-test displays the summary statistics of the two samples. Note that the sample size will always be equal because only cases are included with data available for the two variables.
Next, the arithmetic mean of the differences (mean difference) between the paired observations is given, the standard deviation of these differences and the standard error of the mean difference followed by the confidence interval for the mean difference.
Differences are calculated as sample 2 − sample 1.
In the paired samples t-test the null hypothesis is that the average of the differences between the paired observations in the two samples is zero.
If the calculated P-value is less than 0.05, the conclusion is that, statistically, the mean difference between the paired observations is significantly different from 0.
Note that in MedCalc P-values are always two-sided.

Logarithmic transformation
If you selected the Logarithmic transformation option, the program performs the calculations on the logarithms of the observations, but reports the back-transformed summary statistics.
For the paired samples t-test, the mean difference and confidence interval are given on the log-transformed scale.
Next, the results of the t-test are transformed back and the interpretation is as follows: the back-transformed mean difference of the logs is the geometric mean of the ratio of paired values on the original scale (Altman, 1991).
Normal distribution of differences
For the paired samples t-test, it is assumed that the differences of the data pairs follow a Normal distribution (you do not need to check for normality in the two separate samples). This assumption can be evaluated with a formal test, or by means of graphical methods.
The different formal Tests for Normal distribution may not have enough power to detect deviation from the Normal distribution when sample size is small. On the other hand, when sample size is large, the requirement of a Normal distribution is less stringent because of the central limit theorem.
Therefore, it is often preferred to visually evaluate the symmetry and peakedness of the distribution of the differences using the Histogram, Box-and-whisker plot, or Normal plot.
To do so, you click the hyperlink "Save differences" in the results window. This will save the differences between the paired observations as a new variable in the spreadsheet. You can then use this new variable in the different distribution plots.
Literature
- Altman DG (1991) Practical statistics for medical research. London: Chapman and Hall.
