Meta-analysis: area under ROC curve
| Command: | Statistics |
Description
For a short overview of meta-analysis in MedCalc, see Meta-analysis: introduction.
MedCalc uses the methods described by Zhou et al. (2002) for calculating the weighted summary Area under the ROC curve under the fixed effects model and random effects model.
How to enter data
The data of different studies can be entered as follows in the spreadsheet (example taken from Zhou et al., 2002):

Required input
The dialog box for "Meta-analysis: area under ROC curve" can then be completed as follows:

Studies: a variable containing an identification of the different studies.
Data
Area under ROC curve (AUC): a variable containing the Area under the ROC curve reported in the different studies.
Standard error of AUC: a variable containing the Standard error of the Area under the ROC curve reported in the different studies.
Filter: a filter to include only a selected subgroup of cases in the graph.
Options
- Forest plot: creates a forest plot.
- Marker size relative to study weight: option to have the size of the markers that represent the effects of the studies vary in size according to the weights assigned to the different studies. You can choose the fixed effect model weights or random effect model weights.
- Plot pooled effect - fixed effects model: option to include the pooled effect under the fixed effects model in the forest plot.
- Plot pooled effect - random effect model: option to include the pooled effect under the random effects model in the forest plot.
- Diamonds for pooled effects: option to represent the pooled effects using a diamond (the location of the diamond represents the estimated effect size and the width of the diamond reflects the precision of the estimate).
- Funnel plot: creates a funnel plot to check for the existence of publication bias. See Meta-analysis: introduction.
Results

The program lists the results of the individual studies included in the meta-analysis: the area under the ROC curve, its standard error and 95% confidence interval.
The pooled Area under the ROC curve with 95% CI is given both for the Fixed effects model and the Random effects model (Zhou et al., 2002).
The random effects model will tend to give a more conservative estimate (i.e. with wider confidence interval), but the results from the two models usually agree where there is no heterogeneity. See Meta-analysis: introduction for interpretation of the heterogeneity statistics Cochran's Q and I2. When heterogeneity is present the random effects model should be the preferred model.
See Meta-analysis: introduction for interpretation of the different publication bias tests.
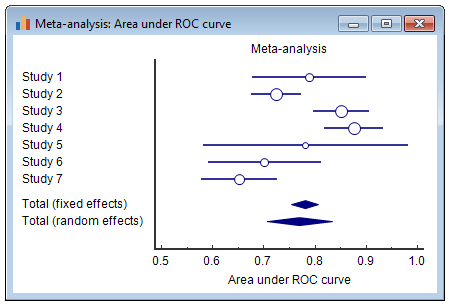
Forest plot
The results of the different studies, with 95% CI, and the pooled Area under the ROC curve with 95% CI are shown in a forest plot:
Literature
- Borenstein M, Hedges LV, Higgins JPT, Rothstein HR (2009) Introduction to meta-analysis. Chichester, UK: Wiley.
- Higgins JP, Thompson SG, Deeks JJ, Altman DG (2003) Measuring inconsistency in meta-analyses. BMJ 327:557-560.

- Zhou XH, NA Obuchowski, DK McClish (2002) Statistical methods in diagnostic medicine. New York: Wiley.
