Waterfall chart
| Command: | Graphs |
Description
In a Waterfall chart, each patient in a trial is presented by a vertical bar on the chart which represents the parameter of interest (for example the change or % change from baseline). The data are presented in order of decreasing magnitude.
In controlled trials, such chart can be used for example to compare the performance of an active drug versus placebo.
How to enter data
Each row of the spreadsheet contains the data for one case, and an optional group identifier.

Required input
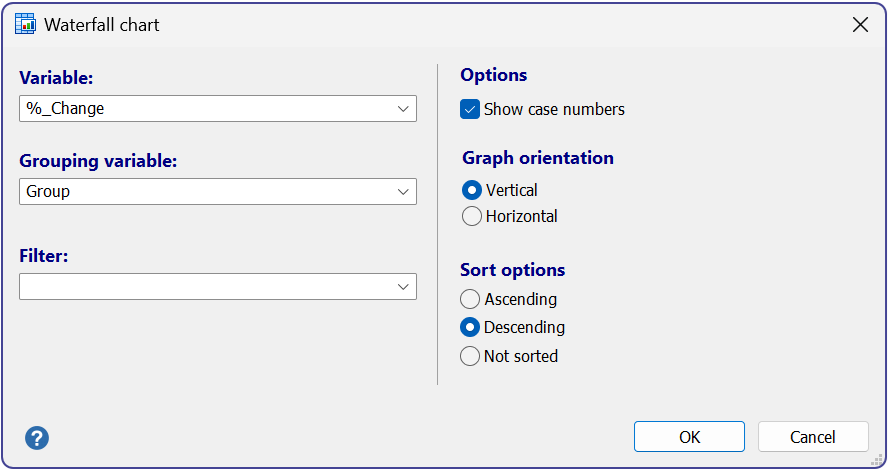
Variables
- Variable: a variable that contains the data to be represented in the graph
- Grouping variable: an optional variable that contains group identifiers
- Optionally, enter a filter in order to include only a selected subgroup of cases in the graph.
Options
- Show case numbers: displays the consecutive case numbers on the X-axis.
- Graph orientation: select a vertical or horizontal orientation (see examples below).
- Sort options: the observations can be sorted ascending, or descending. You can also opt not to sort the observations, in which case they will be shown in the order as they appear in the spreadsheet.
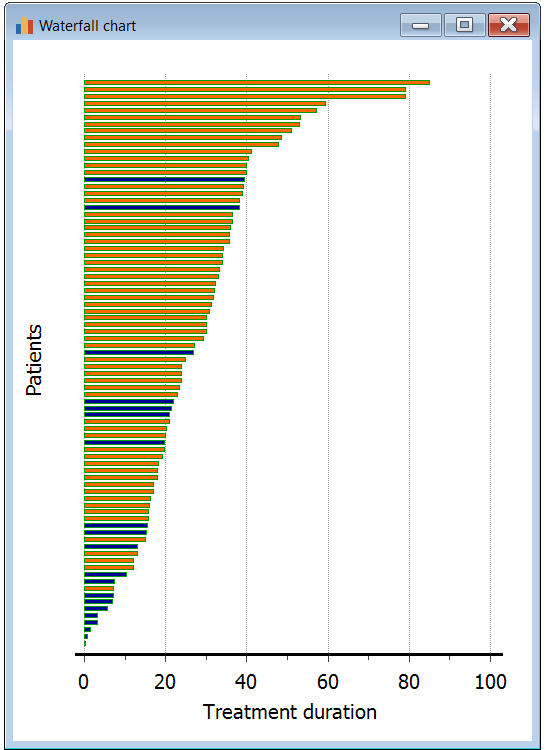
Graph
Example (vertical waterfall chart)

Example of a horizontal waterfall chart (adapted from Gillespie, 2012; data from Kwak et al, 2010).
Literature
- Gillespie TW (2012) Understanding Waterfall Plots. Journal of the Advanced Practitioner in Oncology 3:106-111.

