Serial measurements
| Command: | Statistics |
Description
When serial measurements have been performed, e.g. in a glucose tolerance test, it is often useful to summarize the data on every subject into one or two summarizing measures, such as:
- height of peak (maximum value)
- time to reach peak
- difference last-first value
- area under the curve (AUC)
These summary measures can be obtained and analyzed statistically with the Serial measurements command. The program will create a graph for the observations, and perform an appropriate statistical test to evaluate whether the summary measure differs between the different subgroups.
How to enter the data in the spreadsheet
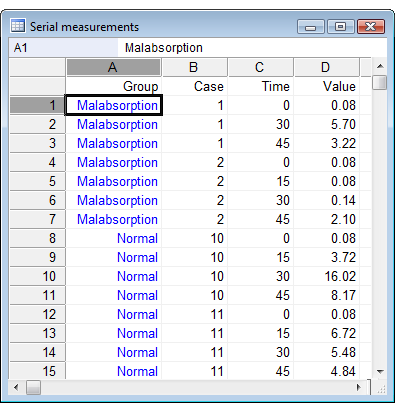
While for any other statistical procedure in MedCalc, the data of one case have to be entered on one single row of the spreadsheet, for serial measurements MedCalc requires the data for all cases to be entered in one single column (Value in the example). Other columns in the spreadsheet must contain:
- a variable for the time: time should be entered as numbers and should be expressed in the same unit (e.g. hours, days); time intervals can be unequal
- a categorical variable that identifies cases
- an (optional) categorical variable that identifies the group a case belongs to.
In the example, case 1 belongs to group "malabsorption" and the value 0.08 was measured at time 0, value 5.70 at time 30 and 3.22 at time 45.
If you have your data organized in a different format, such as the data at different times in different columns, you can use the Stack columns tool to reorganize your data.
Required input

Variable Y (data): this variable contains the serial measurements of all cases.
Variable X (time): this variable contains the time of the different measurements.
Case identification: a categorical variable containing case identification data.
Groups: a categorical variable containing group identification data.
Summary measure: here you select the summary measure of interest for statistical analysis
- Minimum, and Time to reach minimum
- Maximum, and Time to reach maximum
- First observation, Last observation
- Difference Last-First observation
- % Change Last-First observation, calculated as 100x(Last-First)/First
In order to calculate this summary measure, the first observation should never be equal to zero. - Maximum difference with first observation
- % Maximum difference with first observation, calculated as 100x(Max difference/First)
In order to calculate this summary measure, the first observation should never be equal to zero. - Time-weighted average is calculated as the case AUC (baseline 0) divided by its total time interval (time of last observation minus time of first observation). If there is only one observation, this value is taken as the time-weighted average.
- Area Under the Curve (AUC)
The area under the curve can be calculated in 3 different ways, depending on what is taken as the baseline value: 0, first observation, or minimum (when the first observation is taken as the baseline value, the area under the curve can be a negative number).
Note that for the AUC, MedCalc requires that for all cases the first and last observations are set at the same time. If this it not the case, the alternative is to use the Time-weighted average as a summary measure. - % Time above, above or equal to, below, or below or equal to a threshold value.
Options
- Left-align time: this option instructs MedCalc to left-align the times by subtracting the first time value of a case from all other time values of that case. As a result, the start time of each case is set at 0.
Statistical analysis
- Automatic: let MedCalc decide how to analyze the data. If this option is selected, MedCalc will analyze the summary statistics in the different groups and perform a test for Normal distribution (the test for Normal distribution is performed on the whole sample, after the values are transformed, per group, to z-scores). If the data have a Normal distribution, the software will perform a parametric test. If the data do not have a Normal distribution, the software will attempt a Logarithmic transformation. If the data have a Normal distribution after logarithmic transformation, a statistical test will be performed on the log transformed data; if not, a non-parametric test will be used on the non-transformed data.
- Parametric test: assume the summary measure has a Normal distribution and use a parametric test
- Parametric test after Logarithmic transformation: perform a Logarithmic transformation on the summary measure and then do a parametric test.
- Non-parametric test: use a non-parametric test.
For a parametric test, MedCalc uses the t-test when there are 2 groups, or One-way analysis of variance (ANOVA) when there are more than 2 groups.
For a non-parametric test, MedCalc uses the Mann-Whitney when there are 2 groups, or the Kruskal-Wallis test when there are more than 2 groups.
Test for Normal distribution: the option to select a test for Normal distribution is only available when you select "Automatic" statistical analysis.
Results
The results window displays the statistics (sample size, mean, SD, etc.) for the selected summary measure in the different subgroups. Next, a statistical test is performed to test the hypothesis that there is no difference between the subgroups. If the resulting P-value is less than 0.05, the conclusion is that there is a significant difference of the summary measure between the different subgroups.

Graph
The Serial measurements diagram plots the serial data consecutively, for every case.

If there are many cases, you may want to create different graphs for each subgroup. To create a serial measurements graph for all cases in the "normal" group, enter the following in the Filter box:

which gives the following graph:

For the "Malabsorption" group, you select:

which gives the following graph:

Literature
- Bland M (2000) An introduction to medical statistics, 3rd ed. Oxford: Oxford University Press.
- Mathews JNS, Altman DG, Campbell MJ, Royston P (1990) Analysis of serial measurements in medical research. British Medical Journal 300:230-235. PDF
