Relative risk & Odds ratio
| Command: | Statistics |
Description
This procedure will compile a 2x2 table from the data and calculate the Relative risk and Odds ratio for the observed data.
How to enter the data in the spreadsheet
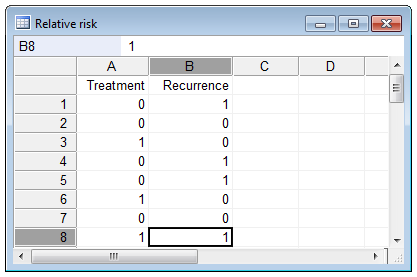
The calculation of Relative risk & Odds ratio requires two categorical variables, one for outcome and one for group. In the example we have a variable "Recurrence" for outcome and a variable "Treatment" for group.
Outcome is preferentially coded 0 for negative (the event of interest was not observed) and 1 for positive (the event of interest was observed). In the example disease recurrence is the event of interest and cases in which disease recurrence was observed have code 1 and cases in which disease recurrence was not observed have code 0 for the variable "Recurrence".
The variable for group can be coded freely, but should not define more than 2 groups. In the example, cases belonging to the treated group have code 1 and cases belonging to the placebo group have code 0 for the variable "Treatment".
Required input
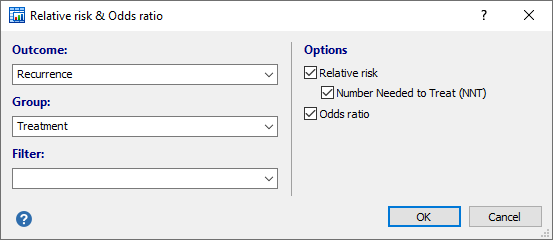
- Outcome: select a dichotomous variable where a positive outcome is coded 1 and a negative outcome is coded 0.
- Group: select a variable with codes that identify 2 groups (e.g. treated and controls).
- Filter: an optional filter to include a subset of data in the analysis.
- Options:
- Relative risk: option to calculate the Relative risk Option: calculate Number Needed to Treat (NNT)
- Odds ratio: option to calculate the Odds ratio
Results
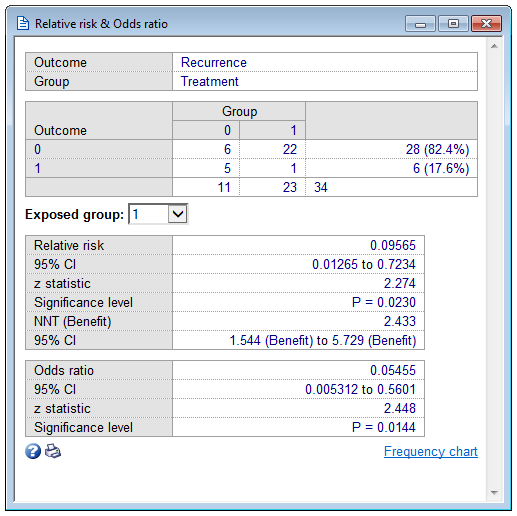
Frequency table
The 2x2 classification table.
Selection of Exposed group
MedCalc assumes the second group (in alphanumerical order) to be the exposed group by default. If in your data the first group is the exposed group, you can select this as the Exposed group and the results will be adapted accordingly.
Relative risk
The program reports the relative risk with its 95% confidence interval (Altman 1991, Daly 1998, Sheskin 2004). The relative risk is the ratio of the proportions of cases having a positive outcome in the two groups. The program also calculates the z-statistic and associated P-value. If P is less than 0.05 it can be concluded that the relative risk is significantly different from 1 and that there is an increased risk in one group compared to the other.
Number Needed to Treat (NNT)
The number needed to treat (NNT) is the estimated number of patients who need to be treated with the new treatment rather than the standard treatment for one additional patient to benefit (Altman 1998).
A negative number for the number needed to treat has been called the number needed to harm.
MedCalc uses the terminology suggested by Altman (1998) with NNT(Benefit) and NNT(Harm) being the number of patients needed to be treated for one additional patient to benefit or to be harmed respectively.
The 95% confidence interval is calculated according to Daly (1998) and is reported as suggested by Altman (1998).
Odds ratio
The program reports the odds ratio with its 95% confidence interval. MedCalc also reports the z-statistic and associated P-value. If P is less than 0.05 it can be concluded that the odds ratio is significantly different from 1 and that the odds in one group are significantly higher than in the other.
Literature
- Altman DG (1991) Practical statistics for medical research. London: Chapman and Hall.
- Altman DG (1998) Confidence intervals for the number needed to treat. British Medical Journal 317: 1309-1312.

- Daly LE (1998) Confidence limits made easy: interval estimation using a substitution method. American Journal of Epidemiology 147: 783-790.
- Sheskin DJ (2004) Handbook of parametric and non-parametric statistical procedures. 3rd ed. Boca Raton: Chapman & Hall /CRC.
