McNemar test on paired proportions
| Command: | Tests |
Description
The McNemar test is a test on a 2x2 classification table when the two classification factors are dependent, or when you want to test the difference between paired proportions, e.g. in studies in which patients serve as their own control, or in studies with "before and after" design.
In the example used by Bland (2000) 1319 schoolchildren were questioned on the prevalence of symptoms of severe cold at the age of 12 and again at the age of 14 years. At age 12, 356 (27%) children were reported to have severe colds in the past 12 months compared to 468 (35.5%) at age 14.
| Severe colds at age 12 | Severe colds at age 14 | Total | |
| Yes | No | ||
| Yes | 212 | 144 | 356 |
| No | 256 | 707 | 963 |
| Total | 468 | 851 | 1319 |
Was there a significant increase of the prevalence of severe cold?
Results
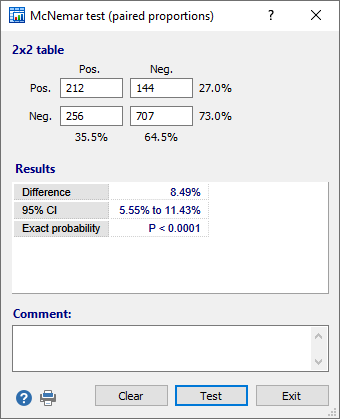
The data are entered as follows in the dialog box:

The program gives the difference between the proportions (expressed as a percentage) with 95% confidence interval. When the (two-sided) P-value is less than the conventional 0.05, the conclusion is that there is a significant difference between the two proportions.
In the example, the difference between the prevalence at age 12 and age 14 is 8.49% with 95% CI from 5.55% to 11.43%, and is highly significant (P<0.0001).
In an optional Comment input field you can enter a comment or conclusion that will be included on the printed report.
Note
The two-sided P-value is based on the cumulative binomial distribution.
The 95% confidence interval is calculated according to Sheskin, 2011.
For the same test on raw (spreadsheet) data see McNemar test in the Categorical statisics menu.
Literature
- Altman DG (1991) Practical statistics for medical research. London: Chapman and Hall.
- Sheskin DJ (2011) Handbook of parametric and non-parametric statistical procedures. 5th ed. Boca Raton: Chapman & Hall /CRC.
