Control chart
| Command: | Graphs |
Description
Creates a quality control chart.
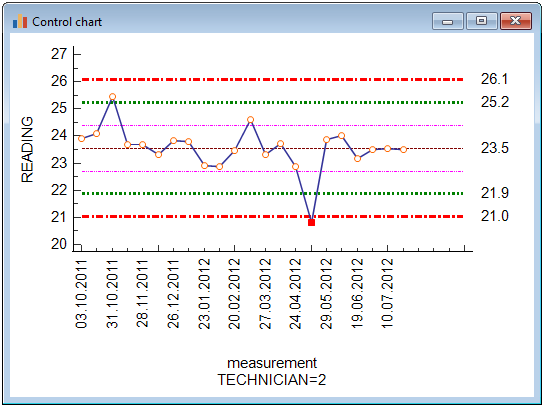
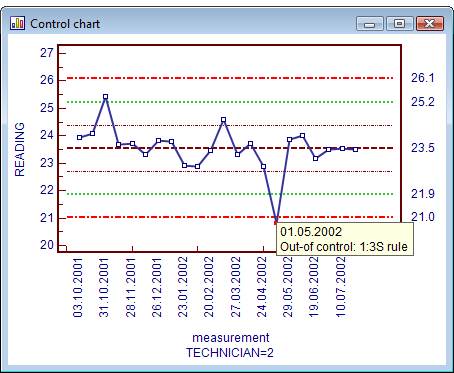
In this chart the data are plotted consecutively, together with a line at the mean, and at −2s, +2s, −3s and +3s (s = standard deviation), i.e. at 95% and 99.7% confidence limits.
Required input
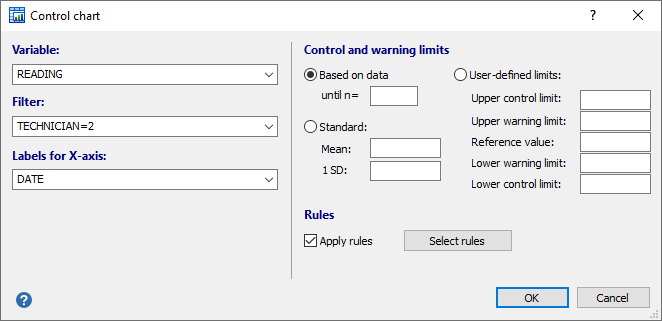
In the Control chart dialog box you define the data to be represented in the quality control chart. First, enter the variable's name in the variable input field. Optionally, you may also enter a filter in order to include only selected data in the graph, e.g. measurements by a particular technician. Also you can enter a variable containing labels for the X-axis (e.g. dates).
Next select the type of control limits:
- The control limits can be based on the data and in this case the program will calculate the mean and standard deviation of the selected data. Option: "until n =" : if the control limits must be based on the first observations only, you can enter the required number here. E.g. if you have 40 observations to be plotted in the control chart, but the control limits must be based on the first 20 observations only, you enter the number 20 here.
- You can select 'Standard' and in this case enter the Mean and Standard Deviation (SD) of the standard used.

- Finally, you can enter the reference value with upper and lower control and warning limits. In this case the upper and lower control and warning limits can be asymmetrical.
When you have completed the dialog box, click OK to proceed.
In the following example, a control chart is created for the technician with code 2.
The result is displayed in the following figure:
Custom control chart
When there are no data available for the variable, the program will ask whether you want to create a custom control chart, i.e. a blank control chart that you can print and on which the lab technician can mark the control measurements manually.
Rules
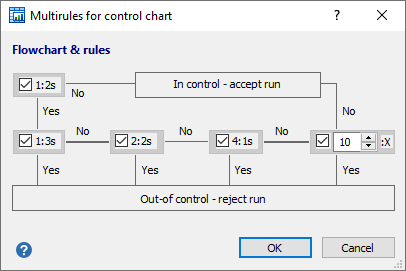
When you click , the following dialog box is displayed, in which you can select a combination of rules to be applied in the control chart:
1:2S rule
If you select the 1:2S rule then the software will check all following rules only if the measurement exceeds the mean ± 2SD (or the warning limits).
If this rule is not selected, then the following rules will be checked also when the measurement does not exceed the mean ± 2SD warning limits.
This will particularly influence the 4:1S rule and 10:X rule.
1:3S rule
If the measurement exceeds the mean + 3SD or mean − 3SD, then the run is considered out of control.
This rule mainly detects random error, but may also be an indication of a large systematic error.
2:2S rule
The run is considered out of control when 2 consecutive measurements exceed the same mean + 2S or the same mean − 2S limit.
This rule detects systematic error.
4:1S rule
The run is considered out of control when 4 or more consecutive measurements exceed the same (mean + 1S) or (mean − 1S) limit.
This rule detects systematic bias.
10:X rule
The run is considered out of control when 10 or more consecutive measurements are on the same side of the mean. The software allows you to select a different value less than 10 for a higher sensitivity or more than 10 for a lower sensitivity of this rule.
This rule detects systematic bias.
Example
When the option Apply rules is selected in the Control chart dialog box, and the 1:3S rule is selected in the Multirules dialog box, then when a measurement exceeds the mean + 3SD or mean - 3SD, this value will be clearly indicated in the graph (using a red marker). Click the value to display information on this measurement:
Literature
- Westgard JO, Barry PL, Hunt MR, Groth T (1981) A multi-rule Shewhart chart for Quality Control in Clinical Chemistry. Clinical Chemistry, 27, 493-501.
