Comparison of standard deviations (F-test)
| Command: | Tests |
Description
Performs an F-test to compares the known standard deviations of two independent samples.
This test is not performed on data in the spreadsheet, but on statistics you enter in a dialog box.
Required input
Comparison of two standard deviations is performed by means of the F-test. In this test, the ratio of two variances is calculated. If the two variances are not significantly different, their ratio will be close to 1.
Comparison of variances: if you want to compare two known variances, first calculate the standard deviations, by taking the square root, and next you can compare the two standard deviations.

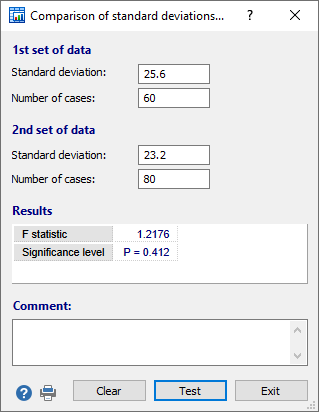
In the dialog box, enter the two standard deviations that you want to compare, and the corresponding number of cases. Next you click Test to perform the test.
Results
In the F-test (or variance ratio test) the square of the standard deviations is calculated to obtain the corresponding variances. If the two variances are not significantly different, then their ratio will be close to 1.
When the calculated P value is less than 0.05 (P<0.05), the conclusion is that the two standard deviations are statistically significantly different.
In the example, the standard deviation was 25.6 and sample size was 60 for the first sample, and for the second sample the standard deviation was 23.2 with sample size equal to 80. The resulting F-statistic was 1.2176 and the associated P-value was 0.412. Since P was not less than 0.05, you can conclude that there is no significant difference between the two standard deviations.
If you want to compare two known variances, first calculate the standard deviations, by taking the square root, and next you can compare the two standard deviations.
In an optional Comment input field you can enter a comment or conclusion that will be included on the printed report.
Literature
- Bland M (2000) An introduction to medical statistics, 3rd ed. Oxford: Oxford University Press.
