Comparison of two proportions
| Command: | Tests |
Description
Performs a Chi-squared test for the comparison of two proportions (from independent samples), expressed as a percentage.
MedCalc uses the N−1 Chi-squared test as recommended by Campbell (2007) and Richardson (2011).
This test is not performed on data in the spreadsheet, but on statistics you enter in a dialog box.
Note that when the total number of cases is less than 20, it may be more appropriate to perform Fisher's exact test.
Required input
In the dialog box, you can enter the two proportions (expressed as percentages) and the total number of cases.
For example when the prevalence of a disease in one sample of a total of 120 patients is 80%, and the prevalence of the disease in another sample of a total of 210 patients is 70%, you will enter the following in the dialog box:
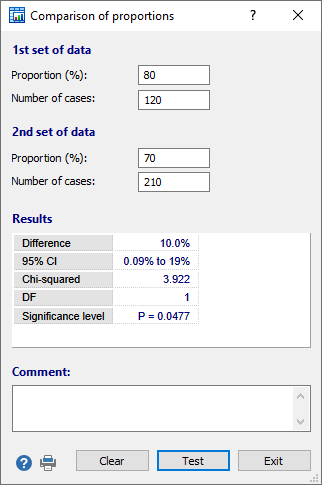
After you click Test, the results of the test are displayed.
Results
- The difference between the two proportions and a 95% confidence interval (CI) for this difference; the CI is calculated according to the recommended method given by Altman et al. (2000).
- Chi-squared test and P value: when this P value is less than 0.05, the conclusion is that the two proportions indeed differ significantly.
In an optional Comment input field you can enter a comment or conclusion that will be included on the printed report.
Literature
- Altman DG, Machin D, Bryant TN, Gardner MJ (Eds) (2000) Statistics with confidence, 2nd ed. BMJ Books. (p. 49)
- Campbell I (2007) Chi-squared and Fisher-Irwin tests of two-by-two tables with small sample recommendations. Statistics in Medicine 26:3661-3675.

- Richardson JTE (2011) The analysis of 2 x 2 contingency tables - Yet again. Statistics in Medicine 30:890.
