Comparison of correlation coefficients
| Command: | Tests |
Description
Calculates the statistical significance of the difference between two independent correlation coefficients.
This test is not performed on data in the spreadsheet, but on statistics you enter in a dialog box.
Required input
In the dialog box enter the correlation coefficients and the corresponding number of cases. Next click Test to calculate the statistical significance of the difference between the two correlation coefficients.
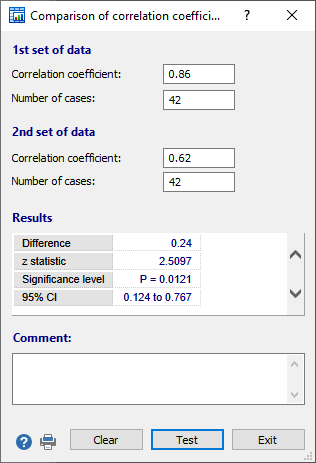
Results
When the P-value is less than 0.05, the conclusion is that the two coefficients are significantly different.
In the example a correlation coefficient of 0.86 (sample size = 42) is compared with a correlation coefficient of 0.62 (sample size = 42). The resulting z-statistic is 2.5097, which is associated with a P-value of 0.0121. Since this P-value is less than 0.05, it is concluded that the two correlation coefficients differ significantly.
In an optional Comment input field you can enter a comment or conclusion that will be included on the printed report.
Computational details
The test used by MedCalc is a z-test on Fisher z-transformed correlation coefficients (Hinkle et al, 1988).
- In a first step, the correlation coefficients r are transformed using Fisher z transformation:
$$ z_r = {1 \over 2}\ln\left({1+r \over 1-r}\right) $$
- The standard error of the difference is:
$$ se_{z_{r_1} - z_{r_2}} = \sqrt { \frac {1}{n1-3} + \frac{1}{n2-3} } $$
- The test statistic z is given by:
$$ z = \frac {z_{r_1} - z_{r_2}}{se_{z_{r_1} - z_{r_2}}} $$For critical values of z, see Values of the Normal distribution.
Literature
- Hinkle DE, Wiersma W, Jurs SG (1988) Applied statistics for the behavioral sciences. 2nd ed. Boston: Houghton Mifflin Company.
