Bland-Altman plot with multiple measurements per subject
| Command: | Statistics |
Description
This procedure creates a Bland-Altman plot for a method comparison study when there is more than one measurement per subject with each laboratory method.
The Bland-Altman plot (Bland & Altman, 1986, 1999, 2007), or difference plot, is a graphical method to compare two measurements techniques. In this graphical method the differences (or alternatively the ratios) between the two techniques are plotted against the averages of the two techniques. Alternatively (Krouwer, 2008) the differences can be plotted against one of the two methods, if this method is a reference or "gold standard" method.
Horizontal lines are drawn at the mean difference, and at the limits of agreement, which are defined as the mean difference plus and minus 1.96 times the standard deviation of the differences. If the differences within mean ± 1.96 SD are not clinically important, the two methods may be used interchangeably.
The plot is useful to reveal a relationship between the differences and the averages, to look for any systematic biases and to identify possible outliers.
How to enter data
This procedure requires that you have your data organized like in the following example (data from Bland & Altman, 2007):
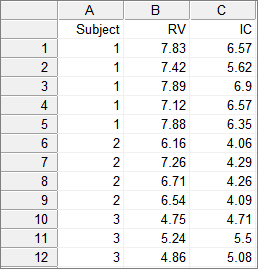
There is one column for subject identification (Subject) and one column for the measurements for each method (RV and IC).
If you have your data organized in a different format, such as the data for the multiple measurements in different columns, you can use the Stack columns tool to reorganize your data (see also the Stack columns worked example).
Required input
Data
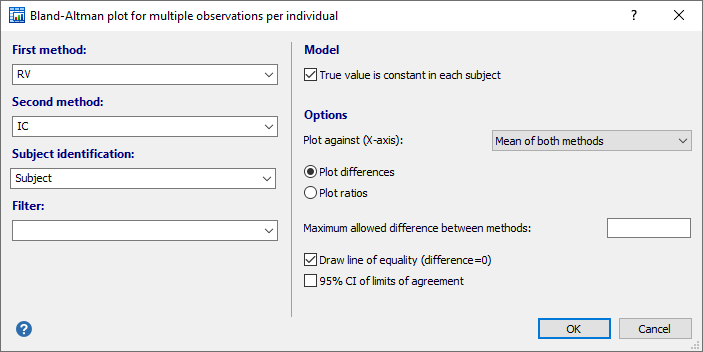
- First method, Second method: Select the variables for the two techniques you want to compare.
- Subject identification: Select the variable that contains the subject identification.
Model
- True value is constant in each subject: Select this option if the true value is constant in each subject (e.g. with both methods several measurements were performed on the same sample).
In the True value is constant in each subject model (see Bland & Altman, 2007) there is only one marker for each subject in the graph. The marker size is relative to the number of observations for the subject. The number of markers is equal to the number of subjects.
In the alternative model, where the True value varies, there is one marker for each observation pair.
Options
- Plot against (X-axis)
In the original Bland-Altman plot (Bland & Altman, 1986) the differences between the two methods are plotted against the mean of the two methods (recommended, Bland & Altman, 1995).
Alternatively, you can choose to plot the differences against one of the two methods, if this is a reference or "gold standard" method (Krouwer, 2008). Finally, you can also plot the differences against the geometric mean of both methods.
- Plot differences or ratios
Plot differences: this is the default option corresponding to the methodology of Bland & Altman, 1986.
Plot ratios: when this option is selected then the ratios of the measurements will be plotted instead of the differences (MedCalc performs the calculations on log-transformed data in the background). This option as well is useful when there is an increase in variability of the differences as the magnitude of the measurement increases. However, the program will give a warning when either one of the two techniques includes zero values.
- Maximum allowed difference between methods: (optionally) the pre-defined clinical agreement limit D. Depending on the option (Plot differences or ratios) selected above, a difference or a ratio must be entered.
The value D must be chosen so that differences in the range −D to D (for ratios 1/D to D) are clinically irrelevant or neglectable.
- Draw line of equality: useful for detecting a systematic difference.
- 95% CI of limits of agreement: shows error bars representing the 95% confidence interval for both the upper and lower limits of agreement.
Calculations
The calculations are performed as described by Zou (2013). For the estimation of the confidence intervals of the limits of agreement, the MOVER method is used (Zou, 2013).
Results
MedCalc creates a graph and a report.
Graph
This is the graph in the True value is constant in each subject model:
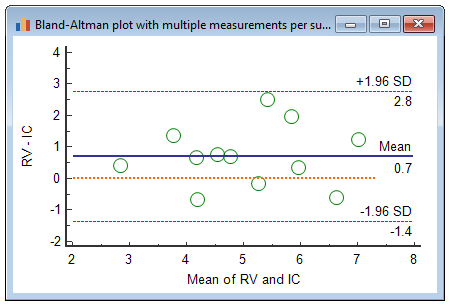
In the True value is constant in each subject model (see Bland & Altman, 2007) there is only one marker for each subject in the graph, and the marker size is relative to the number of observations for the subject. The number of markers is equal to the number of subjects.
In the alternative model, where the True value varies, there is one marker for each observation pair:

Confidence intervals
Optionally, confidence intervals may be displayed for the average difference and for the limits of agreement. These confidence intervals can be represented as error bars or horizontal lines. Right-click on the error bar to set formatting options.
Report
The report contains the exact values for average difference and the limits of agreement with their confidence intervals.
Method A | RV |
|---|---|
Method B | IC |
Sample size | 120 |
|---|
Model | The true value is constant in each subject |
|---|---|
Option | Plot differences |
Mean | 0.7092 |
|---|---|
Lower limit | -1.3524 |
95% Confidence interval | -2.6992 to -0.6284 |
Upper limit | 2.7709 |
95% Confidence interval | 2.0468 to 4.1177 |
|
|
Literature
- Bland JM, Altman DG (1986) Statistical method for assessing agreement between two methods of clinical measurement. The Lancet i:307-310.

- Bland JM, Altman DG (1995) Comparing methods of measurement: why plotting difference against standard method is misleading. The Lancet 346:1085-1087.
- Bland JM, Altman DG (1999) Measuring agreement in method comparison studies. Statistical Methods in Medical Research 8:135-160.
- Bland JM, Altman DG (2007) Agreement between methods of measurement with multiple observations per individual. Journal of Biopharmaceutical Statistics. 17:571-582.
- Krouwer JS (2008) Why Bland-Altman plots should use X, not (Y+X)/2 when X is a reference method. Statistics in Medicine 27:778-780.
- Zou GY (2013) Confidence interval estimation for the Bland-Altman limits of agreement with multiple observations per individual. Statistics in Medicine 22:630-642.
