Analysis of covariance
| Command: | Statistics |
Description
Analysis of covariance (ANCOVA) allows to compare one variable in 2 or more groups taking into account (or to correct for) variability of other variables, called covariates.
Analysis of covariance combines one-way or two-way analysis of variance with linear regression (General Linear Model, GLM).
How to enter data
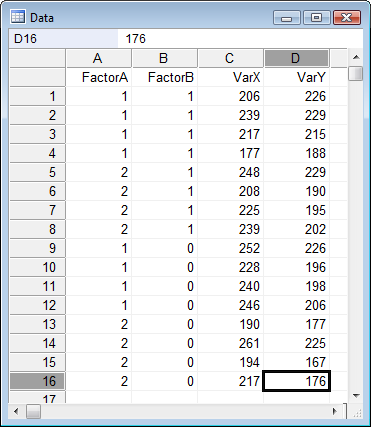
In this example (data from Wildt & Ahtola, 1978) data are entered for 2 factor variables named "FactorA" and "FactorB". The variable "VarY" is the dependent variable and there is one covariate "VarX".
Required input
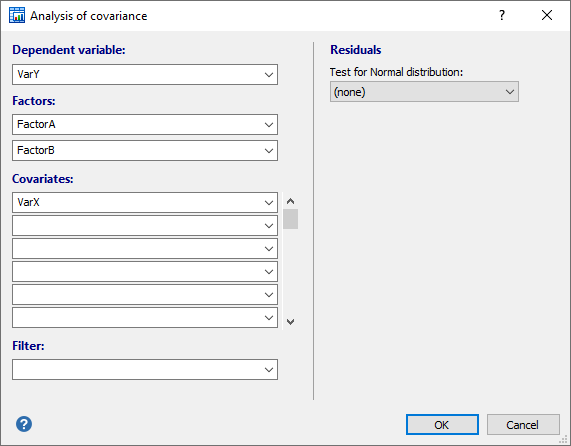
In the dialog box for ANCOVA you select:
- Dependent variable: the (continuous) dependent variable
- Factors: use one categorical variable for a one-way ANCOVA or two categorical variables for a two-way factorial ANCOVA.
- Covariates: one or more covariates.
- Filter: optionally, a filter in order to include only a selected subgroup of cases.
Residuals
Optionally, select a Test for Normal distribution of the residuals.
Results

Levene's test for equality of variances
Prior to the ANCOVA test, Levene's test for equality of variances is performed. If the Levene test is positive (P<0.05) then the variances in the groups are different (the groups are not homogeneous), and therefore the assumptions for ANCOVA are not met.
Homogeneity of regression slopes
The interpretation of ANCOVA and the associated adjusted means relies on the assumption of homogeneous regression slopes for the various groups (Huitema, 1980). If this assumption is not met (P<0.05) the ANCOVA results are unreliable.
Tests of Between-Subjects Effects
If the calculated P-values for the two main factors A and B, or for the 2-factor interaction is less than the conventional 0.05 (5%), then the corresponding null hypothesis is rejected, and you accept the alternative hypothesis that there are indeed differences among groups.
When the 2-factor interaction (FactorA*FactorB) is significant the effect of factor A is dependent on the level of factor B, and it is not recommended to interpret the means and differences between means (see below) of the main factors.
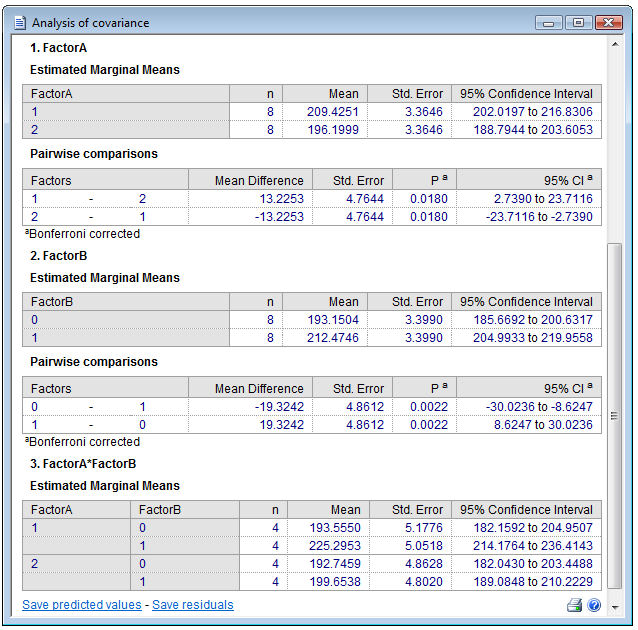
Estimated marginal means
In the following tables, the marginal means (sometimes referred to as "corrected means") with standard error and 95% Confidence Interval are given for all levels of the two factors. Also, differences between groups, with Standard Error, and Bonferroni corrected P-value and 95% Confidence Interval of the differences are reported.
General Linear Model
Since this ANCOVA procedure is an implementation of the General Linear Model (GLM), the procedure:
- reverts to one-way ANOVA when you do not specify covariates and only one factor
- reverts to a 2-way ANOVA when you specify 2 factors but no covariates
- reverts to multiple regression when you do not specify factors.
Analysis of residuals
ANCOVA analysis assumes that the residuals (the differences between the observations and the modeled values) follow a Normal distribution. This assumption can be evaluated with a formal test, or by means of graphical methods.
The different formal Tests for Normal distribution may not have enough power to detect deviation from the Normal distribution when sample size is small. On the other hand, when sample size is large, the requirement of a Normal distribution is less stringent because of the central limit theorem.
Therefore, it is often preferred to visually evaluate the symmetry and peakedness of the distribution of the residuals using the Histogram, Box-and-whisker plot, or Normal plot.
To do so, you click the hyperlink "Save residuals" in the results window. This will save the residual values as a new variable in the spreadsheet. You can then use this new variable in the different distribution plots.
Literature
- Glantz SA, Slinker BK (2001) Primer of applied regression & analysis of variance. 2nd ed. McGraw-Hill.
- Huitema BE (1980) The analysis of covariance and alternatives. Wiley-Interscience.
- Neter J, Kutner MH, Nachtsheim CJ, Wasserman W (1996) Applied linear statistical models. 4th ed. McGraw-Hill.
- Wildt AR, Ahtola OT (1978) Analysis of covariance. Sage Publications.
