t-distribution table (two-tailed)
This table lists critical values of the t-distribution. These critical t-values are used to determine the threshold for significance in various statistical tests and to establish the upper and lower bounds of confidence intervals (see example below the table).
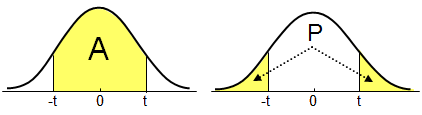
| DF | A P | 0.80 0.20 |
0.90 0.10 |
0.95 0.05 |
0.98 0.02 |
0.99 0.01 |
0.995 0.005 |
0.998 0.002 |
0.999 0.001 |
|---|---|---|---|---|---|---|---|---|---|
| 1 | 3.078 | 6.314 | 12.706 | 31.820 | 63.657 | 127.321 | 318.309 | 636.619 | |
| 2 | 1.886 | 2.920 | 4.303 | 6.965 | 9.925 | 14.089 | 22.327 | 31.599 | |
| 3 | 1.638 | 2.353 | 3.182 | 4.541 | 5.841 | 7.453 | 10.215 | 12.924 | |
| 4 | 1.533 | 2.132 | 2.776 | 3.747 | 4.604 | 5.598 | 7.173 | 8.610 | |
| 5 | 1.476 | 2.015 | 2.571 | 3.365 | 4.032 | 4.773 | 5.893 | 6.869 | |
| 6 | 1.440 | 1.943 | 2.447 | 3.143 | 3.707 | 4.317 | 5.208 | 5.959 | |
| 7 | 1.415 | 1.895 | 2.365 | 2.998 | 3.499 | 4.029 | 4.785 | 5.408 | |
| 8 | 1.397 | 1.860 | 2.306 | 2.897 | 3.355 | 3.833 | 4.501 | 5.041 | |
| 9 | 1.383 | 1.833 | 2.262 | 2.821 | 3.250 | 3.690 | 4.297 | 4.781 | |
| 10 | 1.372 | 1.812 | 2.228 | 2.764 | 3.169 | 3.581 | 4.144 | 4.587 | |
| 11 | 1.363 | 1.796 | 2.201 | 2.718 | 3.106 | 3.497 | 4.025 | 4.437 | |
| 12 | 1.356 | 1.782 | 2.179 | 2.681 | 3.055 | 3.428 | 3.930 | 4.318 | |
| 13 | 1.350 | 1.771 | 2.160 | 2.650 | 3.012 | 3.372 | 3.852 | 4.221 | |
| 14 | 1.345 | 1.761 | 2.145 | 2.625 | 2.977 | 3.326 | 3.787 | 4.140 | |
| 15 | 1.341 | 1.753 | 2.131 | 2.602 | 2.947 | 3.286 | 3.733 | 4.073 | |
| 16 | 1.337 | 1.746 | 2.120 | 2.584 | 2.921 | 3.252 | 3.686 | 4.015 | |
| 17 | 1.333 | 1.740 | 2.110 | 2.567 | 2.898 | 3.222 | 3.646 | 3.965 | |
| 18 | 1.330 | 1.734 | 2.101 | 2.552 | 2.878 | 3.197 | 3.610 | 3.922 | |
| 19 | 1.328 | 1.729 | 2.093 | 2.539 | 2.861 | 3.174 | 3.579 | 3.883 | |
| 20 | 1.325 | 1.725 | 2.086 | 2.528 | 2.845 | 3.153 | 3.552 | 3.850 | |
| 21 | 1.323 | 1.721 | 2.080 | 2.518 | 2.831 | 3.135 | 3.527 | 3.819 | |
| 22 | 1.321 | 1.717 | 2.074 | 2.508 | 2.819 | 3.119 | 3.505 | 3.792 | |
| 23 | 1.319 | 1.714 | 2.069 | 2.500 | 2.807 | 3.104 | 3.485 | 3.768 | |
| 24 | 1.318 | 1.711 | 2.064 | 2.492 | 2.797 | 3.090 | 3.467 | 3.745 | |
| 25 | 1.316 | 1.708 | 2.060 | 2.485 | 2.787 | 3.078 | 3.450 | 3.725 | |
| 26 | 1.315 | 1.706 | 2.056 | 2.479 | 2.779 | 3.067 | 3.435 | 3.707 | |
| 27 | 1.314 | 1.703 | 2.052 | 2.473 | 2.771 | 3.057 | 3.421 | 3.690 | |
| 28 | 1.313 | 1.701 | 2.048 | 2.467 | 2.763 | 3.047 | 3.408 | 3.674 | |
| 29 | 1.311 | 1.699 | 2.045 | 2.462 | 2.756 | 3.038 | 3.396 | 3.659 | |
| 30 | 1.310 | 1.697 | 2.042 | 2.457 | 2.750 | 3.030 | 3.385 | 3.646 | |
| 31 | 1.309 | 1.695 | 2.040 | 2.453 | 2.744 | 3.022 | 3.375 | 3.633 | |
| 32 | 1.309 | 1.694 | 2.037 | 2.449 | 2.738 | 3.015 | 3.365 | 3.622 | |
| 33 | 1.308 | 1.692 | 2.035 | 2.445 | 2.733 | 3.008 | 3.356 | 3.611 | |
| 34 | 1.307 | 1.691 | 2.032 | 2.441 | 2.728 | 3.002 | 3.348 | 3.601 | |
| 35 | 1.306 | 1.690 | 2.030 | 2.438 | 2.724 | 2.996 | 3.340 | 3.591 | |
| 36 | 1.306 | 1.688 | 2.028 | 2.434 | 2.719 | 2.991 | 3.333 | 3.582 | |
| 37 | 1.305 | 1.687 | 2.026 | 2.431 | 2.715 | 2.985 | 3.326 | 3.574 | |
| 38 | 1.304 | 1.686 | 2.024 | 2.429 | 2.712 | 2.980 | 3.319 | 3.566 | |
| 39 | 1.304 | 1.685 | 2.023 | 2.426 | 2.708 | 2.976 | 3.313 | 3.558 | |
| 40 | 1.303 | 1.684 | 2.021 | 2.423 | 2.704 | 2.971 | 3.307 | 3.551 | |
| 42 | 1.302 | 1.682 | 2.018 | 2.418 | 2.698 | 2.963 | 3.296 | 3.538 | |
| 44 | 1.301 | 1.680 | 2.015 | 2.414 | 2.692 | 2.956 | 3.286 | 3.526 | |
| 46 | 1.300 | 1.679 | 2.013 | 2.410 | 2.687 | 2.949 | 3.277 | 3.515 | |
| 48 | 1.299 | 1.677 | 2.011 | 2.407 | 2.682 | 2.943 | 3.269 | 3.505 | |
| 50 | 1.299 | 1.676 | 2.009 | 2.403 | 2.678 | 2.937 | 3.261 | 3.496 | |
| 60 | 1.296 | 1.671 | 2.000 | 2.390 | 2.660 | 2.915 | 3.232 | 3.460 | |
| 70 | 1.294 | 1.667 | 1.994 | 2.381 | 2.648 | 2.899 | 3.211 | 3.435 | |
| 80 | 1.292 | 1.664 | 1.990 | 2.374 | 2.639 | 2.887 | 3.195 | 3.416 | |
| 90 | 1.291 | 1.662 | 1.987 | 2.369 | 2.632 | 2.878 | 3.183 | 3.402 | |
| 100 | 1.290 | 1.660 | 1.984 | 2.364 | 2.626 | 2.871 | 3.174 | 3.391 | |
| 120 | 1.289 | 1.658 | 1.980 | 2.358 | 2.617 | 2.860 | 3.160 | 3.373 | |
| 150 | 1.287 | 1.655 | 1.976 | 2.351 | 2.609 | 2.849 | 3.145 | 3.357 | |
| 200 | 1.286 | 1.652 | 1.972 | 2.345 | 2.601 | 2.839 | 3.131 | 3.340 | |
| 300 | 1.284 | 1.650 | 1.968 | 2.339 | 2.592 | 2.828 | 3.118 | 3.323 | |
| 500 | 1.283 | 1.648 | 1.965 | 2.334 | 2.586 | 2.820 | 3.107 | 3.310 | |
| ∞ | 1.282 | 1.645 | 1.960 | 2.326 | 2.576 | 2.807 | 3.090 | 3.291 |
Example: establish the upper and lower bounds of a confidence interval of a mean
The mean of a sample is 128.5, the standard error of the mean (SEM) is 6.2, and the sample size is 32.
What is the 99% confidence interval of the mean?
The degrees of freedom (DF) is n−1 = 31, the t-value in the column for area 0.99 is 2.744. The 99% CI therefore is:
| mean − t SEM | to | mean + t SEM |
| 128.5 − 2.744 × 6.2 | to | 128.5 + 2.744 × 6.2 |
| 111.5 | to | 145.5 |