Kaplan-Meier survival analysis
| Command: | Statistics |
Description
Performs survival analysis and generates a Kaplan-Meier survival plot.
In clinical trials the investigator is often interested in the time until participants in a study present a specific event or endpoint. This event usually is a clinical outcome such as death, disappearance of a tumor, etc.
The participants will be followed beginning at a certain starting-point, and the time will be recorded needed for the event of interest to occur.
Usually, the end of the study is reached before all participants have presented this event, and the outcome of the remaining patients is unknown. Also the outcome is unknown of those participants who have withdrawn from the study. For all these cases the time of follow-up is recorded (censored data).
In MedCalc, these data can be analyzed by means of a life-table, or Kaplan-Meier curve, which is the most common method to describe survival characteristics.
How to enter data
To be able to analyze the data, you need to enter the data in the spreadsheet as follows:
- in one column, a code can be entered to assign the case to a particular group (study group - control group).
- in a second column, the survival time has to recorded
- in a third column, it must be recorded whether or not the case has reached the endpoint (by entering the code 1) or whether the time is censored, i.e. the outcome is unknown (by entering the code 0);
The order of these columns is of course not important. Also, the rows do not have to be sorted in any way.

The case in row 1 belonged to group 1, and reached the endpoint after 10 units of time. The case in row 3 also belonged to group 1 and was followed for 9 units of time. The outcome of this case is unknown (withdrawn from study, or end of study) (data from Freireich et al., Blood 1963; 21:699-716).
From these data, MedCalc can easily calculate and construct the Kaplan-Meier curve.
Required input
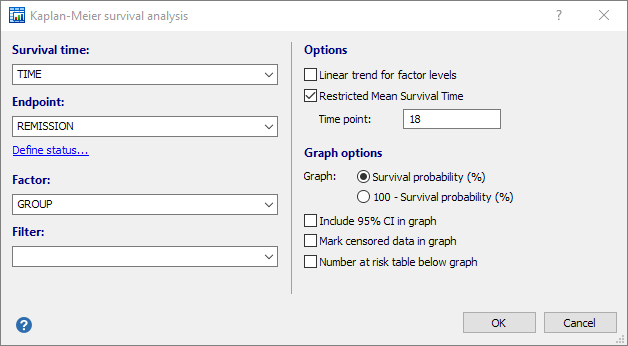
In this dialog box the following data need to be entered:
- Survival time
The name of the variable containing the time to reach the event of interest, or the time of follow-up.
- Endpoint
The name of a variable containing codes 1 for the cases that have reached the endpoint, or code 0 for the cases that have not reached the endpoint, either because they withdrew from the study, or the end of the study was reached. If your data are coded differently, you can use the Define status tool to recode your data.
- Factor
For Factor select a qualitative or discrete variable (grouping variable - GROUP in the example). This qualitative factor may either be character or numeric codes. These codes are used to break-up the data into several subgroups. If you want to study the effect of a continues variable on survival time, you can convert this continuous variable into a discrete variable using the Create groups tools.MedCalc will allow comparison of survival curves for up to 6 subgroups.If no Factor variable is selected, then MedCalc will display only one survival curve (all data are considered to belong to one group).
- Filter
A filter to include only a selected subgroup of cases in the graph.- Options
- Linear trend for factor levels: allows testing for a linear trend across levels of the factor (Altman, 1991). It is appropriate if factor levels have a natural ordering (for example, factor codes represent doses applied to different groups). Kaplan-Meier assumes that the factor levels are equally spaced.
- Restricted Mean Survival Time: option to calculate the restricted mean survival time (RMST), and perform comparison of the RMST between groups. The Restricted Mean Survival Time is the average event-free survival time up to a prespecified time point. It is equivalent to the area under the Kaplan-Meier curve from the beginning of the study through that time point. The selected time point must lie between the first and last event in every group; it not, then the software will reset it to the lowest time point of the last event among the different groups.
- Graph:
- Survival probability (%): plot Survival probability (%) against time (descending curves)
- 100 - Survival probability (%): plot 100 - Survival probability (%) against time (ascending curves)
- Include 95% CI in graph: Allows to plot the 95% confidence interval for the survival curves.
- Mark censored data in graph: Mark censored data in the graph with a small vertical line.
- Number at risk table below graph: Shows a table below the graph with the number of subjects at risk.
When all data have been entered click OK. MedCalc will open 2 windows: one with the survival graphs, and one with the statistical results.
Graph
The survival curves are drawn as a step function, as shown in the following example:

With the option "Include 95% CI in graph" selected, the graph looks like this:

When the option "Number at risk table below graph" is selected, the result is:

Results
Cases summary
This table shows the number of cases that reached the endpoint (Number of events), the number of cases that did not reach the endpoint (Number censored), and the total number of cases.

Mean and median survival
The mean and median survival time are reported with their 95% confidence interval (CI).
The mean survival time is estimated as the area under the survival curve in the interval 0 to tmax (Klein & Moeschberger, 2003).
The median survival is the smallest time at which the survival probability drops to 0.5 (50%) or below. If the survival curve does not drop to 0.5 or below then the median time cannot be computed. The median survival time and its 95% CI is calculated according to Brookmeyer & Crowley, 1982.

Restricted Mean Survival Time
The restricted mean survival time (RMST) is reported with its 95% confidence interval. If groups are defined then a table is displayed with the differences of RMST between groups, the 95% CI of the difference, and associated P-value (Royston & Karmar, 2013).

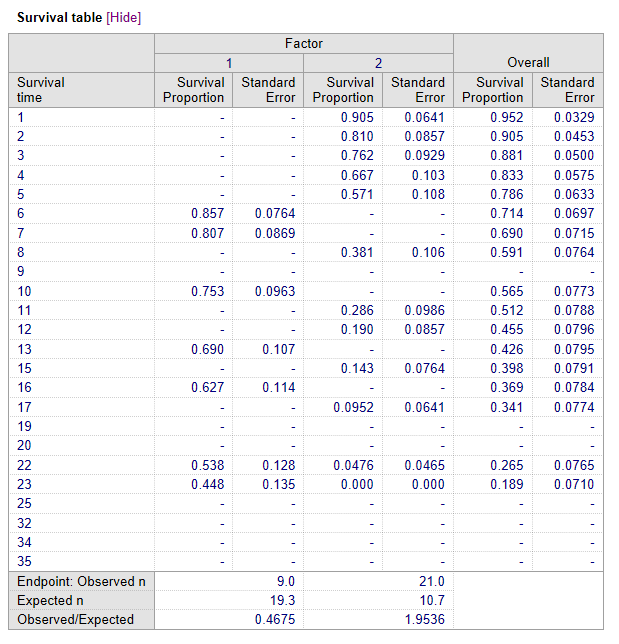
Survival table
At each observed time point, the survival proportions (with standard error) are listed for all groups, as well as the overall survival proportion.
Comparison of survival curves (Logrank test)
When you scroll down, you see the result of the logrank test for the comparison between the two survival curves:
In this example, 9 cases in group 1 and 21 cases in group 2 presented the outcome of interest. The Chi-squared statistic was 16.79 with associated P-value of less than 0.0001. The conclusion therefore is that, statistically, the two survival curves differ significantly, or that the grouping variable has a significant influence on survival time.

Hazard ratios with 95% Confidence Interval
When you have specified a factor then MedCalc also calculates the hazard ratios with 95% confidence interval (CI). Hazard is a measure of how rapidly the event of interest occurs. The hazard ratio compares the hazards in two groups.
In the example the hazard ratio is 5.1462 so that the estimated relative risk of the event of interest occurring in group 2 is 5.1462 higher than in group 1. This hazard ratio is significantly different from the value 1 (corresponding to equal hazards) since the confidence interval 2.3506 to 11.2663 does not include the value 1.
The hazard ratios and confidence intervals are calculated according to Altman et al., 2000.
Note that the computation of the hazard ratio assumes that the ratio is consistent over time, so therefore if the survival curves cross, the hazard ratio statistic should be ignored.

Logrank test for trend
If more than two survival curves are compared, and there is a natural ordering of the groups, then MedCalc can also perform the logrank test for trend. This tests the probability that there is a trend in survival scores across the groups.
Literature
- Altman DG (1991) Practical statistics for medical research. London: Chapman and Hall.
- Altman DG, Machin D, Bryant TN, Gardner MJ (Eds) (2000) Statistics with confidence, 2nd ed. BMJ Books.
- Brookmeyer R, Crowley JA (1982) A confidence interval for the median survival time. Biometrics 38:29-41.
- Klein JP, Moeschberger ML (2003) Survival Analysis. Techniques for censored and truncated data, 2nd ed. New York: Springer Publishers.
- Royston P, Karmar KB (2013) Restricted mean survival time: an alternative to the hazard ratio for the design and analysis of randomized trials with a time-to-event
outcome. BMC Medical Research Methodology 13:152.

See also
- Filter
