Age-related reference interval
| Command: | Statistics |
Description
An age-related (age-specific or age-dependent) reference interval is a reference interval that varies with the patients' age.
The methodology that MedCalc uses to model a continuous age-related reference interval is based on the methods described by Altman (1993), Altman & Chitty (1993), and Wright & Royston (1997a).
The method includes the following steps:
- If the distribution of the measurements (the variable for which to establish a reference interval) shows skewness at different levels of age, the measurements are transformed logarithmically or using a Box-Cox power transformation.
- The transformed measurements are modelled on age using weighted polynomial regression (Altman & Chitty, 1994). This regression model gives the mean of the (transformed) measurements as a function of age: mean(age).
- The residuals of this regression model are calculated.
- The absolute residuals, multiplied by $ \sqrt { \pi / 2 } $ are modelled on age using weighted polynomial regression (Altman, 1993). This second regression model gives the standard deviation of the (transformed) measurements as a function of age: SD(age).
- For every age in the observed range, the reference interval is calculated by taking mean(age) ± z SD(age). For a 95% reference interval z = 1.96. If the data were initially transformed in step 1, MedCalc back-transforms the results to the original scale.
- The model is evaluated by analyzing and plotting z-scores for all observations. The z-score for an observed value y is calculated by $$ z = \frac { y - \operatorname {mean}(age) } { \operatorname {SD}(age) } $$The z-scores should be normally distributed. If they are not, the model may not be appropriate and other powers for the polynomial model may be selected.
Required input
The example makes use of the data on biparietal diameter (outer-inner) from Chitty et al., 1994. Data downloaded from http://www.stata.com/stb/stb38/sbe15/bpd.dta

Measurements and age variables
- In the dialog box you identify the variable for the measurements and the variable for age. You can also enter or select a filter in order to include only a selected subgroup of cases in the statistical procedure, as described in the Introduction part of this manual.
Reference interval options
- Report centiles: you can select the different centiles of interest. For example, for a 95% double sided reference interval you select the centiles 2.5 and 97.5.
- Confidence intervals: click this button so set options for the calculation of confidence intervals. See below for more details. Note already that this option is only available when you select only 1 or 2 centiles.
Powers for polynomial model
- Powers: select the powers for the polynomial model for Mean and for SD. The special value 0 means logarithmic transformation (base 10). For example, when you select the powers 0, 1 and 2 the model will include Log(age), age1=age and age2:
Y = b0 + b1 Log(age) + b2 age + b3 age2
The values bi are the coefficients to be estimated by the software. The value b0 is the constant term in the regression model.
Options for Measurements variable
- Logarithmic transformation: if the measurements data require a logarithmic transformation (e.g. when the data are positively skewed), select the Logarithmic transformation option.
- Box-Cox transformation: this will allow to perform a Box-Cox transformation with the following parameters:
- Lambda: the power parameter λ
- Shift parameter: the shift parameter is a constant c that needs to be added to the data when some of the data are negative.
- Button Get from data: click this button to estimate the optimal value for Lambda and suggest a value for the shift parameter c when some of the observations are negative. The program will suggest a value for Lambda with 2 to 3 significant digits.
When you perform a Box-Cox transformation, MedCalc will automatically transform the measurements data with the selected parameters and back-transforms the results to the original scale for presentation.x(λ) = ( (x+c)λ − 1) / λ when λ ≠ 0 x(λ) = log(x+c) when λ = 0 - Test for outliers: select the method based on Reed et al. (1971) or Tukey (1977) to automatically check the data for outliers (alternatively select none for no outlier testing). The method by Reed et al. will test only the minimum and maximum observations; the Tukey test can identify more values as outliers. The tests will create a list of possible outlying observations, but these will not automatically be excluded from the analysis. The possible outliers should be inspected by the investigator who can decide to exclude the values (see Exclude & Include). For other methods for outlier detection see Outlier detection.
z-scores
- Test for Normal distribution: select a statistical test to evaluate if the distribution of the z-scores is compatible with a Normal distribution (see Tests for Normal distribution).
Results
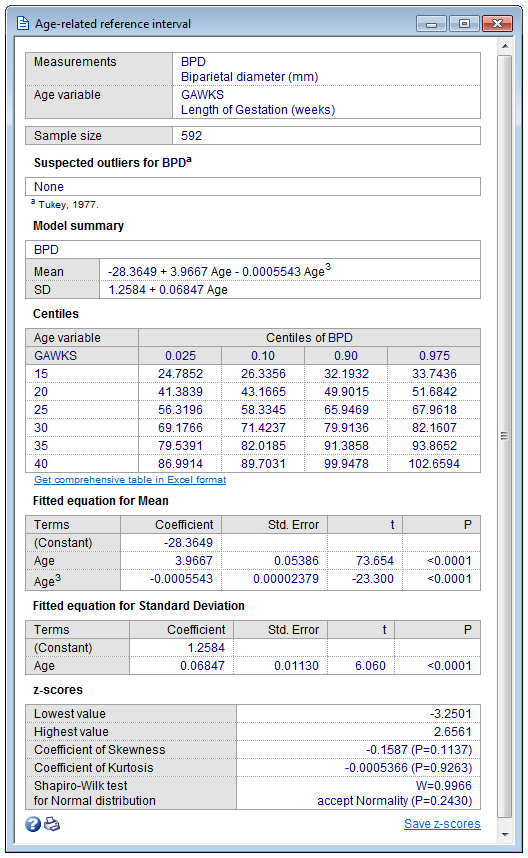
Suspected outliers
The program produces a list of possible outliers of the measurements, detected by the methods based on Reed et al. (1971) or Tukey (1977). The method by Reed et al. tests only the minimum and maximum observations; the Tukey test can identify more values as outliers. Note that this does not automatically exclude any values from the analysis. The observations should be further inspected by the investigator who can decide to exclude the values. Click on the listed values (which are displayed as hyperlinks) to show the corresponding data in the spreadsheet (see Exclude & Include).
Model summary
This table gives a summary of the model.
The first row shows the outcome variable.
- If no transformation was selected, the outcome variable is the measurements variable (e.g. BPD).
- If a logarithmic transformation was selected, the outcome variable is the base 10 logarithm of the measurements variable and will be shown as Log(BPD).
- If a Box-Cox transformation was selected, the outcome variable is Box-Cox transformed measurements variable, and will be shown as (BPD+c)λ
Next the regression equation is given for Mean and SD of the outcome variable.
- If no transformation was selected, the equations directly give the estimated Mean and SD of the measurements variable.
- If a logarithmic transformation or Box-Cox transformation was selected, the equations give the estimated Mean and SD of the transformed measurements, and the results must be back-transformed to their original scale. MedCalc back-transforms the results automatically in the following table (Centiles) and graphs.
Centiles
This table lists the centiles at different ages (for about 6 to 12 values of age).
Below this table there is a hyperlink to get a more comprehensive table in Excel format, for about 60 to 120 values of age. This Excel file includes the formulae for the different centiles and therefore can easily be shortened or expanded to your needs.
Fitted equations for Mean and Standard Deviation
This table lists the details of the weighted regression for the Mean of the measurements and next for the Standard Deviation.
The different coefficients are listed with their standard error and P-value.
The P-values should not be given too much attention. Specifically, they must not be used to decide if a term should remain or should be removed from the model. It is the magnitude of the coefficient itself that is of interest.
z-scores
The analysis of the z-scores is an important step in the evaluation of how well the model fits the data.
- Range: the lowest and highest value of z-scores.
- Skewness: the coefficient of Skewness (Sheskin, 2011) is a measure for the degree of symmetry in the variable distribution. The coefficient of Skewness should be close to 0 (see Skewness & Kurtosis).
- Kurtosis: The coefficient of Kurtosis (Sheskin, 2011) is a measure for the degree of tailedness (Westfall, 2014) in the variable distribution. The coefficient of Kurtosis should be close to 0 (see Skewness & Kurtosis).
- Test for Normal Distribution: The result of this test is expressed as 'accept Normality' or 'reject Normality', with P value.
If P is higher than 0.05, it may be assumed that the z-scores follow a Normal distribution and the conclusion 'accept Normality' is displayed.
Graphs
Scatter plot with centile curves
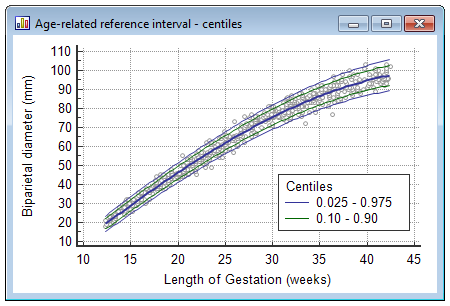
This plot shows a scatter diagram of the measurements versus age with the calculated mean (central line) and centile curves.
z-scores
This graph shows the z-scores plotted against age.
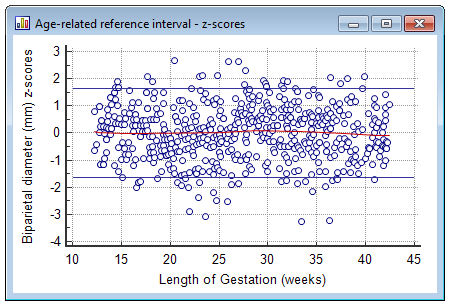
Horizontal lines are drawn at z-scores of −1.645 and 1.645.
The central line (red in the example) is a 80% smoothed LOESS (Local Regression Smoothing) trendline.
The z-scores should not display any pattern and must be randomly scattered about 0 at all ages (Altman & Chitty, 1993). It is expected that 5% of cases lie above the line corresponding to z=1.645 and 5% of cases are expected to lie below the line corresponding with z=−1.645; and these cases should be randomly distributed across the observed age range. Any deviation from this indicates that the model needs modification.
In the graph's Info panel, the exact number of observations below z=−1.645 and above z=1.645 is reported.
Confidence intervals
MedCalc allows to calculate confidence intervals for the reference limits using bootstrapping (Wright & Royston, 1997b).
Proceed as follows:
- Select only one or two centiles. MedCalc cannot calculate confidence intervals for more centiles at the same time.

- Next click and complete the new dialog box as follows:

- Bootstrap confidence intervals: select None if you do not want to calculate confidence intervals; otherwise select a 90% or 95% confidence interval.
- Bootstrap replications: enter the number of bootstrap replications. High numbers increase accuracy but also increase processing time.
- Random-number seed: this is the seed for the random number generator. Enter 0 for a random seed; this can result in different confidence intervals when the procedure is repeated. Any other value will give a repeatable "random" sequence, which will result in repeatable values for the confidence intervals.
- When you return to the main dialog box, select Box-Cox transformation and click to automatically get the best values for Lambda and Shift parameter.
This step is necessary because at every step in the bootstrap procedure, MedCalc will do an automatic Box-Cox transformation to estimate and model the skewness of each bootstrap sample (Wright & Royston 1997a). By doing a Box-Cox transformation in the original procedure, you align the results of the centiles with the confidence intervals.
- Click OK to proceed. The calculations can take a few minutes to complete.
- The confidence intervals are displayed in the report table:

Literature
- Altman DG (1993) Construction of age-related reference centiles using absolute residuals. Statistics in Medicine 12:917-924.

- Altman DG, Chitty LS (1993) Design and analysis of studies to derive charts of fetal size. Ultrasound in Obstetrics and Gynecology 3:378-384.
- Altman DG, Chitty LS (1994) Charts of fetal size: 1. Methodology. British Journal of Obstetrics and Gynaecology 101:29-34.
- Chitty LS, Altman DG, Henderson A, Campbell S (1994) Charts of fetal size: 2. Head Measurements. British Journal of Obstetrics and Gynaecology 101: 35-43.
- Reed AH, Henry RJ, Mason WB (1971) Influence of statistical method used on the resulting estimate of normal range. Clinical Chemistry 17:275-284.
- Sheskin DJ (2011) Handbook of parametric and nonparametric statistical procedures. 5th ed. Boca Raton: Chapman & Hall /CRC.
- Tukey JW (1977) Exploratory data analysis. Reading, Mass: Addison-Wesley Publishing Company.
- Westfall PH (2014) Kurtosis as Peakedness, 1905 - 2014. R.I.P. The American Statistician 68:191-195.
- Wright EM, Royston P (1997a) Simplified estimation of age-specific reference intervals for skewed data. Statistics in Medicine 16:2785-2803.
- Wright EM, Royston P (1997b) A comparison of statistical methods for age-related reference intervals. Journal of the Royal Statistical Society, A 160:47-69.